
2026 Large Healthcare & Hospital Systems Industry Report
Now in its second year, the Large Healthcare & Hospital Systems report excerpts the Tenth Annual Employee Relations Benchmark Study with added questions to explore the factors shaping employee relations in this segment.
A Message from the CEO

Large healthcare & hospital systems are navigating significant external pressure. Consolidation is reshaping organizational structures. An aging population is driving demand for care, and Medicaid funding shifts are squeezing already constrained budgets. Patients feel that strain, and so does the workforce caring for them. At the same time, the labor relations landscape is changing, creating more uncertainty around union-related activity. These forces are increasing the volume, complexity and risk of employee issues and putting greater demands on employee relations. Now in its second year, this special report goes deeper into the large healthcare & hospital systems segment with industry-specific data to better understand the operational and procedural realities shaping employee relations work. These findings offer insights that leaders in this segment frequently request: How they compare to similar organizations, what others are doing well and where they are struggling.
We don’t have to approach this work in the dark, and we shouldn’t. Use these findings to assess your own practices and make more informed decisions about where to focus next. None of us can control the external forces reshaping healthcare, but employee relations leaders can control how well their organizations are prepared to meet them. Thank you for the rigor and care you bring to this uniquely demanding, high-stakes work. And thank you to the practitioners who shared their data and experience to help build a resource large healthcare and hospital systems can rely on.
Deb Muller, CEO and Founder of HR Acuity


Large Healthcare & Hospital Systems Respondent Profile
Large Healthcare & Hospital Systems Segment
The organizations in this segment of the healthcare industry typically provide a comprehensive range of services, spanning inpatient, outpatient and coordinated care across multiple facilities such as hospitals, clinics, physician practices, sub-acute care and skilled nursing.
These services are delivered under a single organizational umbrella, within an interconnected structure or through strong affiliations where workforce complexity, patient-facing service and organizational risk intersect. This environment amplifies the same trends found across the broader Benchmark respondents, often at a larger scale. Care delivery, regulatory demands, staffing constraints and patient-facing roles make employee relations work especially demanding.
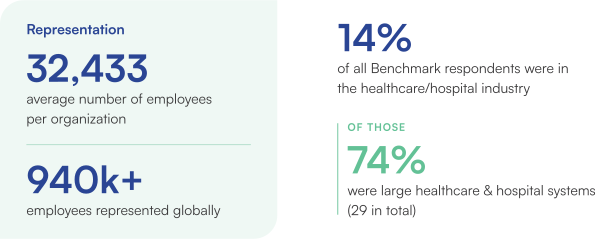
Respondent Profile: Large Healthcare & Hospital Systems
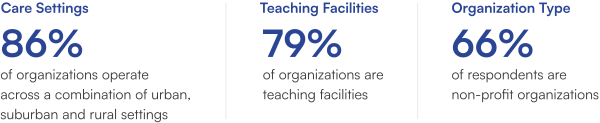
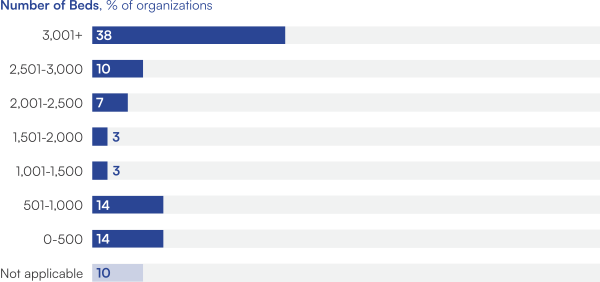
This year’s report provides more granular data on issues and practices in this segment. The majority of respondents are non-profit teaching facilities, with multiple sites in urban settings and over 2,000 beds. They provide a wide-range of care across every U.S. region, with fairly even distribution across the Northeast, Southeast, Midwest and Southwest, and less presence in the Northwest.
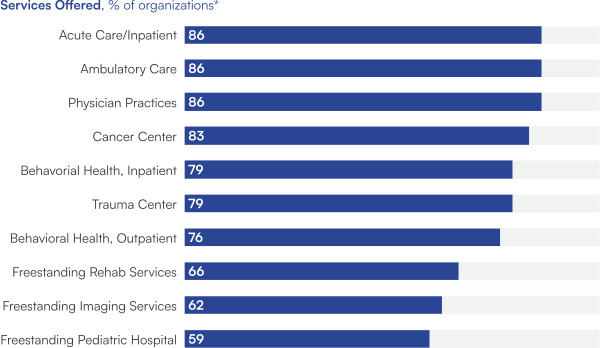
*Fewer than one-third of organizations reported offering long-term care, skilled nursing or subacute services.
Organizational Model and Case Assignment
Centralization is common, but routing methods vary.
Nearly all respondents in this segment use a centralized or mixed model to manage employee relations, consistent with overall Benchmark respondents, but case assignment methods vary widely by comparison. This may reflect contextual factors that influence case assignment. Employee relations cases in healthcare often carry high stakes, from urgent patient and employee safety issues to round-the-clock shift coverage.
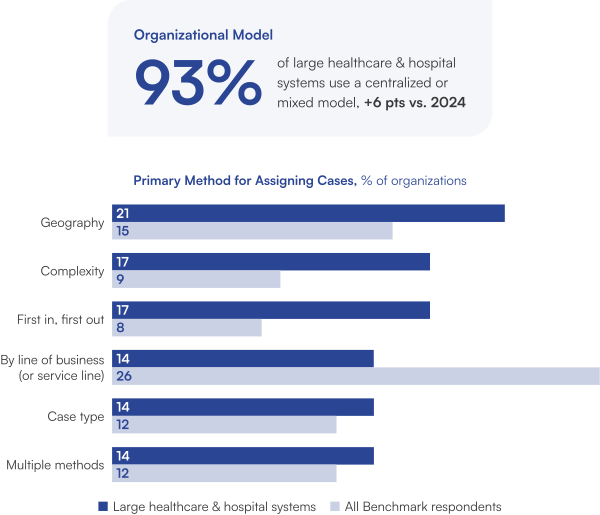
Notable Movement: Service line assignment led in 2024. No single method dominated in 2025, likely reflecting that varied care structures call for different processes.
Staffing Resources
Fewer resources, rising demands.
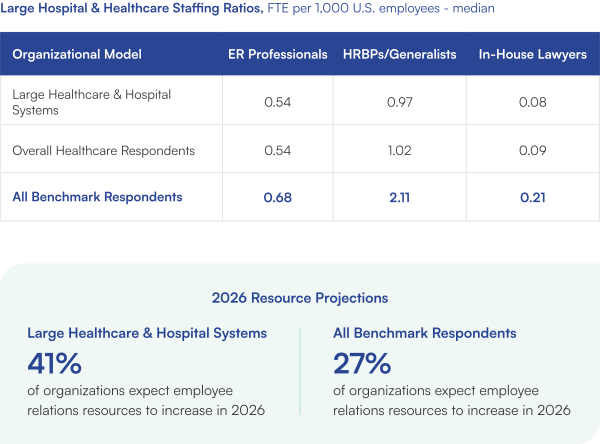
Large healthcare & hospital systems typically have fewer employee relations resources than broader Benchmark respondents. Staffing has not kept pace with rising case volume and complexity. When teams are stretched thin, investigation quality and timeliness can suffer and burnout risk rises. When asked about staffing plans for 2026, two in five large healthcare & hospital systems said they expected to add employee relations resources.
Adopting technology such as secure, AI-guided tools enables leaders to address day-to-day issues, freeing employee relations professionals to focus on higher-risk cases, pursue strategic priorities and deploy resources more effectively. Connecting caseload data and outcomes to staffing benchmarks can strengthen the case for additional resources.
Three Insights Shaping Employee Relations in Large Healthcare & Hospital Systems
Pressure is building in higher-risk areas.
 Large healthcare & hospital systems reported higher growth in case volume than broader Benchmark respondents across several issue types, led by accommodation requests, social media issues, unprofessional conduct, union-related activity, retaliation and EEOC or agency matters. This complex mix of day-to-day workforce concerns and higher-scrutiny matters requires careful documentation, consistent processes and sound judgment.
Resource planning calls for evidence-backed support.
 Healthcare employee relations teams remain leaner than overall Benchmark respondents, though more leaders expect to add resources in 2026. Staffing requests are strongest when tied to workload, issue mix, time to close and process requirements across complex care environments. Clearer evidence and a stronger connection to trust, risk and operational impact support resource needs.
Maturity depends on greater discipline.
 Process maturity and data use are improving, but many organizations still rely on suggested investigation processes, train investigators as needed and use metrics more for reporting than to highlight areas where targeted intervention or early action may be needed. Teams are also more cautious about adopting AI in this segment. Disciplined processes, reliable data and clear governance can help teams act earlier, embrace new tools with confidence and strengthen outcomes for employees and the organization.
Issue Trends
Issue Reporting
Anonymous reporting is universal, but data insights are hidden.
All respondents across the healthcare industry offer employees a way to report concerns anonymously, but access alone does not reveal how employees use reporting channels.
Compared to overall Benchmark respondents, fewer large healthcare & hospital systems track the actual number of anonymous and named reports, and among those that do, a greater share of reports are anonymous. Examining this data provides a more complete picture of workplace culture and employee sentiments such as psychological safety and fear of retaliation.
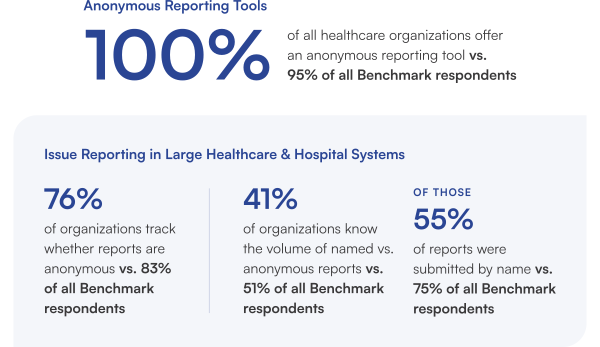
Pattern to Watch: A high volume of anonymous reports can signal a lack of confidence in the process or indicate that employees are not comfortable raising concerns. Monitoring channel usage helps leaders spot emerging or systemic cultural issues so they can build trust.
Issue Volume and Case Complexity
Case volume continues to rise, but a lack of issue-level tracking masks complexity.
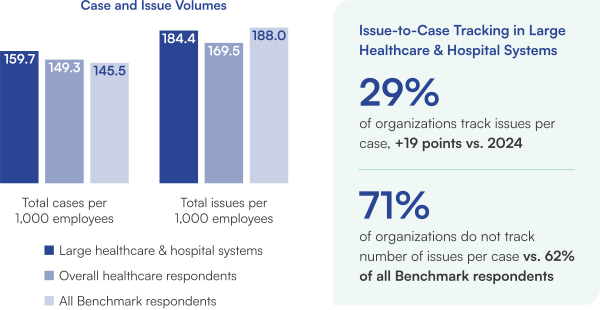
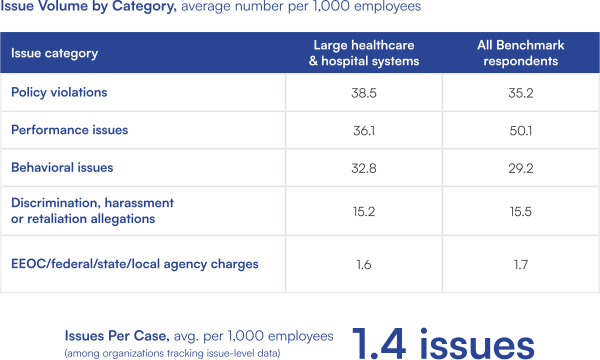
Large healthcare & hospital systems reported higher case volume than the broader Benchmark respondents, though issue volume was more on par. Issue volume still outpaces cases, a sign that many cases carry more than one issue. Case counts alone don’t capture that complexity.
Few organizations in this segment track the number of issues per case, suggesting that complexity is under estimated. Without issue-level data, patterns, trends and root causes that could inform staffing requests and process decisions remain largely invisible.
Issue Volume by Case Type
The pattern looks familiar, but the pressures underneath differ.
Issue volume in large healthcare & hospital systems broadly mirrors the trend in the full Benchmark Study. Day-to-day workforce and conduct issues drive most volume, with serious allegations representing a smaller share. This segment cited greater increases in time and attendance, policy violations and behavioral issues than overall Benchmark respondents. This concentration signals where manager support, training and prevention efforts are likely to have the greatest impact. The rising volume of high-risk discrimination, harassment and retaliation claims also requires increasingly complex, time-intensive investigations that demand far more attention and resources than the numbers alone suggest.
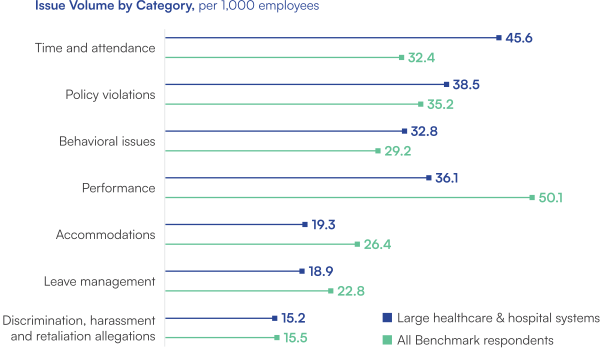
Pattern to Watch: Discrimination, harassment and retaliation allegations in this segment mirror the all-time Benchmark Study high reported by this year’s overall respondents.
Healthcare-Specific Issue Volume by Case Type
A few areas carry most of the volume.
This year, large healthcare & hospital systems answered additional questions to identify areas of volume concentrated by service line or department.
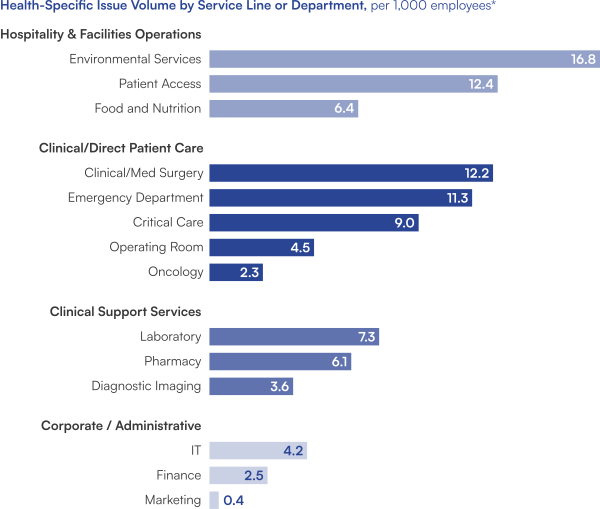
*This data reflects a subset of the segment sample and should be viewed as illustrative.
These findings reflect a smaller subset of this segment and serve as a starting point for a closer look at where issues arise.
Issue volume experienced within hospitality and facilities operations, particularly environmental services and patient access, was on par with or exceeded several clinical care departments. This highlights additional areas where manager support, training and proactive monitoring can guide initiatives to minimize risk and improve employee experience.
Issue Volume Trends
Issue volume and risk continue to rise.
Consistent with the overall Benchmark findings, many large healthcare and hospital systems reported an increase in issue volume across conduct, accommodation and wellbeing-related categories. The share reporting a retaliation increase nearly doubled from 2024, highlighting the value of providing ongoing support after a case closes.
Equipping leaders with tools to manage issues before they escalate and providing employee relations professionals with data and analytics to monitor patterns enables earlier interventions and strategic actions to build a more trusted workplace.
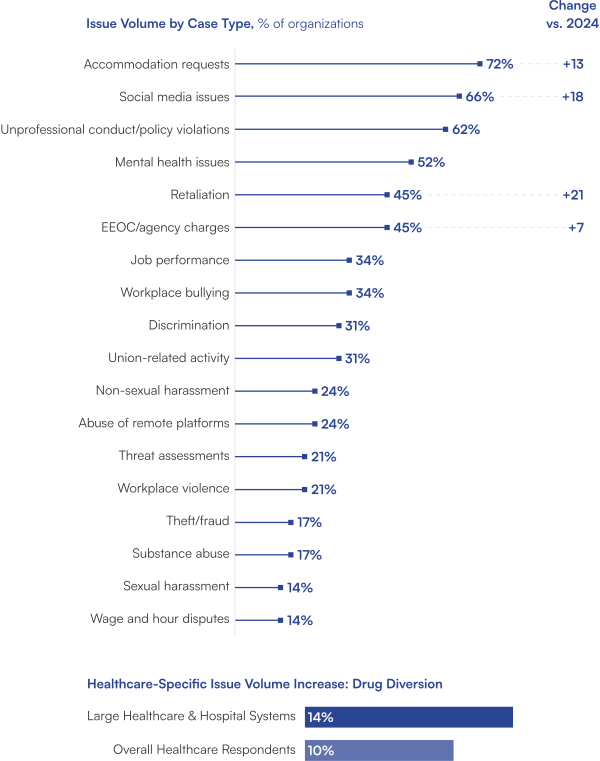
Pattern to Watch: Retaliation saw the sharpest jump in organizations reporting an increase, reason to evaluate these claims thoroughly to limit agency exposure.
Issue Volume Attribution
External influences drive the greatest pressures.
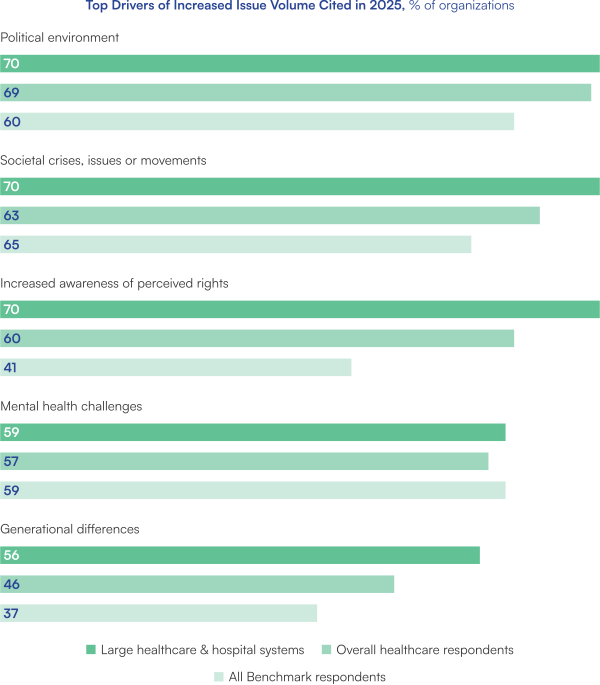
The findings reinforce the multi-year Benchmark Study trend of external forces increasingly impacting employee relations issues. Compared to the broader Benchmark respondents, an even greater portion of large healthcare & hospital systems cited the political environment, societal crises and increased awareness of perceived rights as top drivers of issue volume. Mental health challenges and generational differences also ranked high, underscoring the growing complexity teams face as they manage a wider range of interpersonal and cultural dynamics.
Healthcare-Specific Issue Volume Attribution
Operational pressures are also driving issue volume.
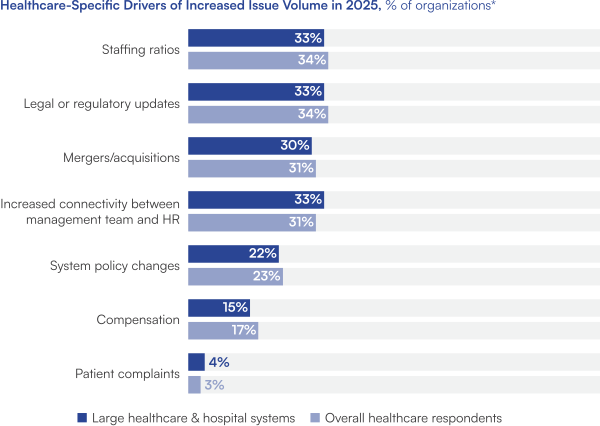
This year’s Benchmark survey also gathered information about additional factors contributing to issue volumes for large healthcare & hospital systems. The findings suggest that operational pressures, rather than clinical or patient-driven factors, are shaping employee relations activity in this segment. Anticipating these structural drivers can help leaders plan resources ahead of volume shifts.
*No respondents cited Serious Safety Incidents as a contributing factor in increased issue volume.
Time-to-Close
Varied resolution times highlight the need for tighter processes.
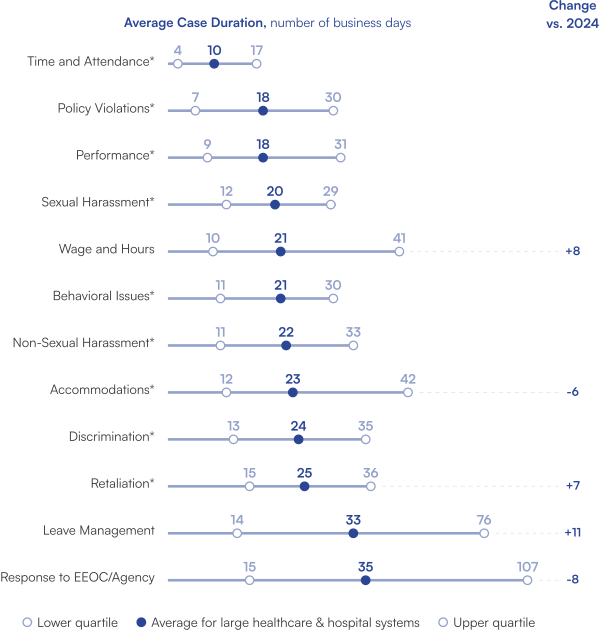
Large healthcare & hospital systems resolved most cases faster than broader Benchmark respondents. Leave management and wage & hour disputes were the only exceptions, and both remained open longer in this segment than in 2024. Time to resolution for EEOC and agency matters improved sharply, while retaliation claims took longer to close, likely reflecting the added rigor these high-risk, escalation-prone cases require.
Streamlined, consistent processes can help ensure timely, compliant outcomes even as case demands vary across this high-stakes environment.
*Indicates time to resolution for large hospital & healthcare systems was less than for all Benchmark respondents.
Investigation Processes & Outcomes
Investigation Processes & Training
Adoption of required investigation processes is on the rise, but regular training still lags.
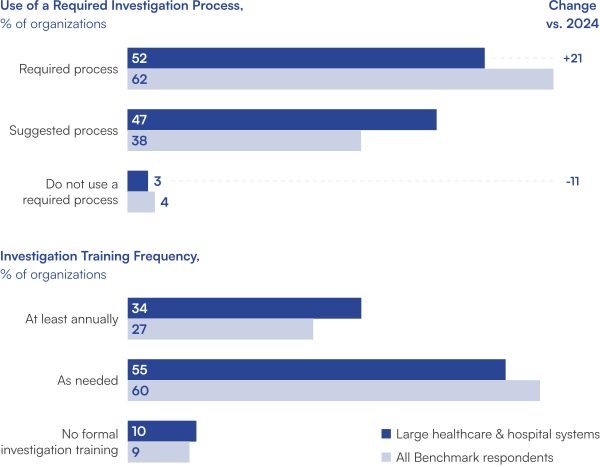
Required investigation process use jumped 21 points in 2025 for large healthcare & hospital systems, to just over half, while the share of organizations using no process fell sharply. The segment still trails the decade-high rate reported in the full Benchmark Study, and closing that gap ensures investigations are thorough, impartial and defensible. Only one-third of organizations train investigators at least annually. While this is ahead of overall Benchmark respondents, most large healthcare & hospital systems still train investigators only as needed. Together, regular training and required, structured investigation processes lead to better outcomes and reduced legal risk.
Substantiation Rates
Visibility into case disposition is essential to manage risk.
Tracking case disposition reveals investigation effectiveness and potential bias in outcomes. Fewer than half of large healthcare & hospital systems track overall substantiation rates, and only a small fraction track substantiation rates by issue type, obscuring process gaps and patterns in risk and accountability. This is especially relevant since the number of organizations that cited an increase in retaliation claims, which often follow discrimination claims, rose sharply in this segment in 2025. Access to substantiation data helps leaders spot, anticipate and address emerging risks, improve investigation processes and address policy and training needs to build a stronger culture of trust.
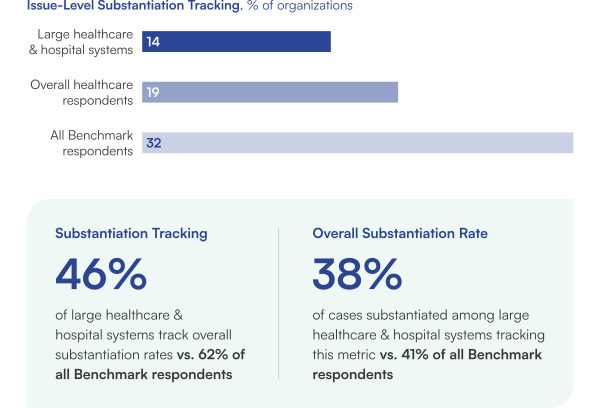
Data Connection: As retaliation claims climb, tracking substantiation by issue type helps surface patterns and guide follow-up that builds trust.
Metrics & Analytics
Tracking and Using Data & Metrics
Strategic use of data remains limited.
Fewer large healthcare & hospital systems rely on purpose-built platforms to manage employee issues and workplace investigations than the overall Benchmark respondents. While data usage increased year over year in several categories, use for developing broader insights declined, and fewer organizations used metrics to shape policy or identify staffing needs. Solutions designed to address the complexities of employee relations and provide comprehensive analytics are essential for identifying trends and risks and supporting data-driven decision-making.
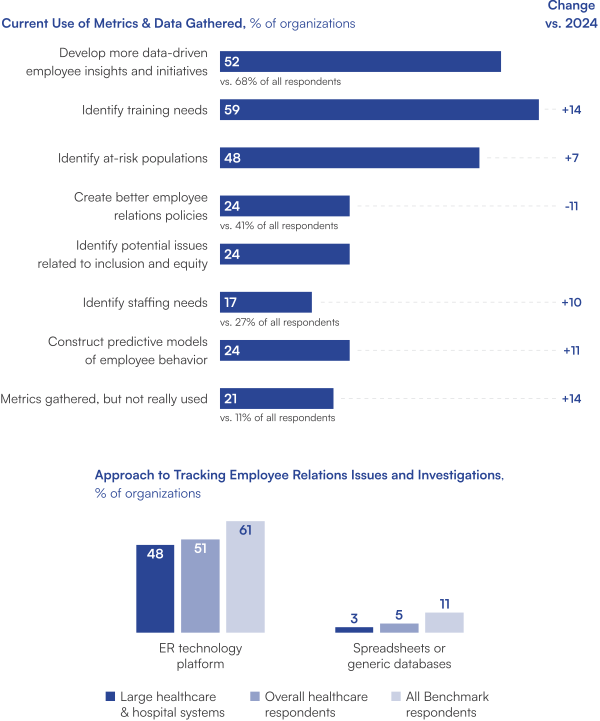
Pattern to Watch: Respondents in this segment are almost twice as likely to gather data that goes unused, reflecting gaps in analytics capabilities or unclear ownership that limit valuable insights.
Advanced Tracking and Predictive Analytics
Advanced analytics are still early-stage.
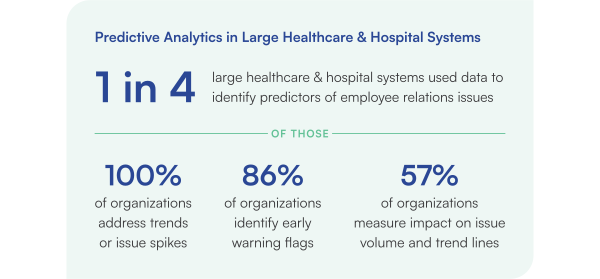
Large healthcare & hospital systems integrate less workforce data with investigation data than broader Benchmark respondents across nearly every category. Connecting employee relations data with broader people analytics gives leaders a fuller view of workforce dynamics, supporting better outcomes and closer alignment with overall business strategy. Only one in four organizations in this segment used data to predict employee behaviors that lead to employee relations issues, and among that small group, specific use of insights is limited. Moving from data collection to actionable insights helps leaders get ahead of issues before they escalate and minimizes future issues.
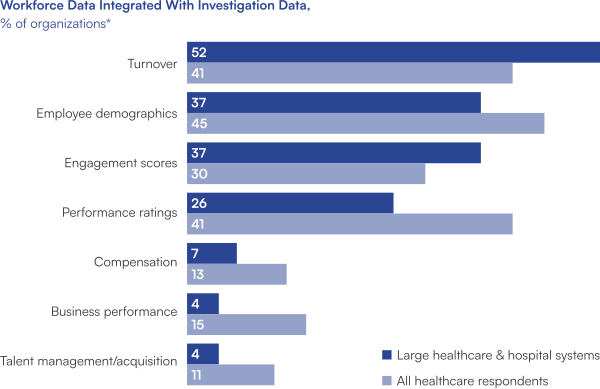
*No respondents integrated Customer satisfaction/C-NPS data with employee relations data.
Healthcare-Specific Advanced Tracking
Clinical and operational data is rarely integrated with investigation data.
Healthcare-specific data is not widely combined with employee relations data for deeper insights. Involuntary termination and attendance data are integrated most often, while clinical measures like patient outcomes and patient satisfaction scores are integrated rarely, if at all. Connecting these operational and clinical data points to investigation data gives leaders a fuller picture of where risk is building.
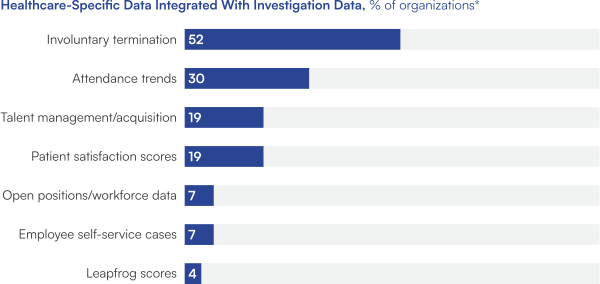
*No respondents reported integrating data on patient outcomes with employee relations data for further insights.
Pattern to Watch: Organizations are not integrating patient outcome data with employee relations data, despite operating in a patient-facing, safety-driven environment.
AI Use
AI in Healthcare Employee Relations
AI adoption lags and governance is tighter.
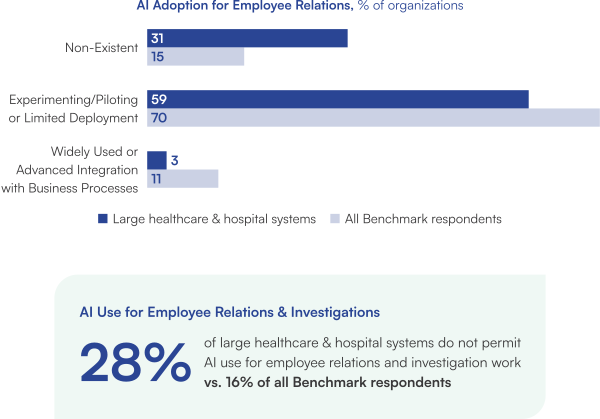
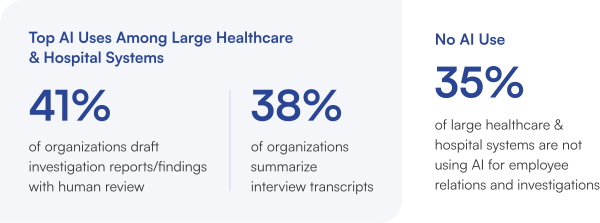
Large healthcare & hospital systems adopted AI more cautiously than overall Benchmark respondents. Nearly a third reported no active or approved AI use, roughly double the rate cited in the full Benchmark Study, and advanced AI use is also rare. Governance is also tighter: More than a quarter of organizations prohibit AI use for employee relations and investigation work, well above the overall Benchmark Study rate.
This hesitation is understandable given HIPAA liabilities and heightened regulatory scrutiny in the healthcare industry. Considering the complexity and volume of employee relations work in this segment, the opportunity is to thoughtfully implement AI for real efficiencies, with clear guardrails, reliable data and human judgment central to how it is use.
Top Uses of AI in Employee Relations
AI’s potential extends well beyond current use.
AI adoption in large healthcare & hospital systems remains relatively limited, with current use concentrated in drafting investigation reports and findings with human review and summarizing interview transcripts. The potential extends well beyond these early use cases.
With appropriate human oversight and safeguards, broader adoption across areas such as case analysis, information retrieval, trend identification, workflow improvement and manager support could help employee relations teams work more efficiently and effectively amid growing case volumes and increasingly complex workplace issues.
Data Connection: Real opportunity exists to use AI for trend identification, helping teams spot risk earlier and respond with targeted action.
