Trust & Risk Statement™ Getting Started Guide
The Trust & Risk Statement™ surfaces impact through a set of industry-standard metrics that demonstrate organizational health, prioritize action and enable data-driven decision-making at scale. It converts complex employee relations data into a single view of the three outcomes executives value: Cost avoided, risk predicted and trust earned.
Executive Summary
Employee relations sits at the center of some of your organization’s most critical risks: Cultural, reputational, legal and financial. Yet unlike other core business functions, ER has historically lacked standardized, executive-level metrics to demonstrate its impact. As a result, employee relations teams are often asked to explain complex, high-stakes work using lagging indicators or qualitative narratives in environments that demand data to drive decision-making.
The Trust & Risk Statement™ is here to change that.
Designed to make employee relations measurable and strategic, the Trust & Risk Statement™ translates ER activity into business-relevant insights leaders can act on. It shifts the focus from reactive, after-the-fact reporting to leading indicators that help organizations anticipate risk, allocate resources more effectively and build trust at scale.
This Getting Started Guide is designed to help employee relations leaders take the first step and focus on what matters most — without overcomplicating the work. It provides a clear starting point for aligning employee relations data to business priorities and building a consistent, credible approach to measuring trust and risk over time…even when data and processes are still maturing. Most importantly, this guide reflects the realities ER leaders face today.
Here’s what you can expect from this guide:
- A clear framework for aligning employee relations metrics to business priorities.
- Guidance on selecting indicators across operational efficiency, trust, risk and compliance.
- Practical steps for auditing data, breaking down silos and establishing a reliable baseline.
- A narrative structure for communicating insights and impact to executive stakeholders.
As expectations for accountability, transparency and risk management continue to rise, ER leaders have a growing opportunity to demonstrate their team’s value. The Trust & Risk Statement provides the structure to do exactly that, transforming employee signals into insights executives understand and trust.
The Trust & Risk Statement™ Framework
The Trust & Risk Statement is built on a simple concept: Meaningful insight results from consistent, comparable data aligned to business priorities. This framework helps you put that concept into action. It defines the core components of the Trust & Risk Statement and the standardized metrics that make trust and risk measurable across organizations.
Together, they establish a shared language for evaluating employee relations performance, identifying emerging risk and informing executive decision-making. You may already track some of these data points today. Others will require new definitions, cross-functional partnerships or time to establish a baseline. That’s expected. The pages that follow introduce the full framework first, then guide you through a practical, step-by-step approach to applying it.
Sign up for our Employee Relations Newsletter to stay up to date on all things ER.
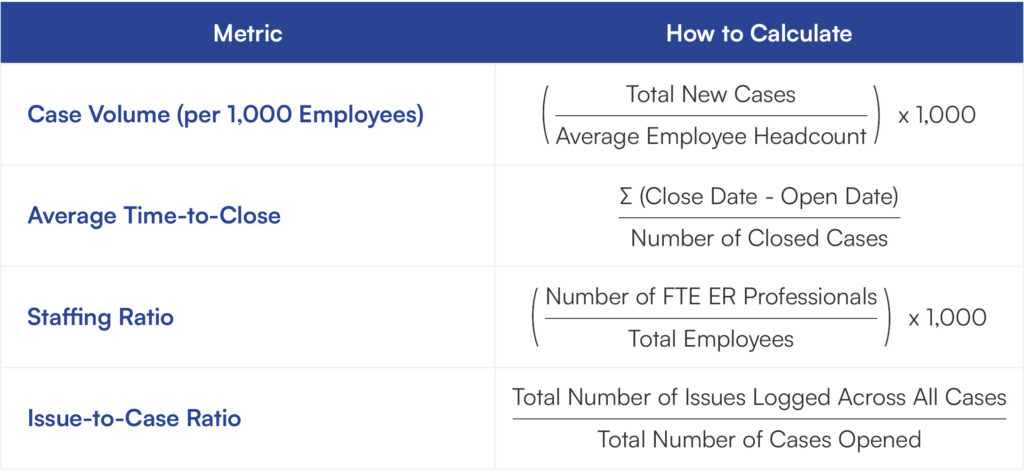
Operational Efficiency Metrics
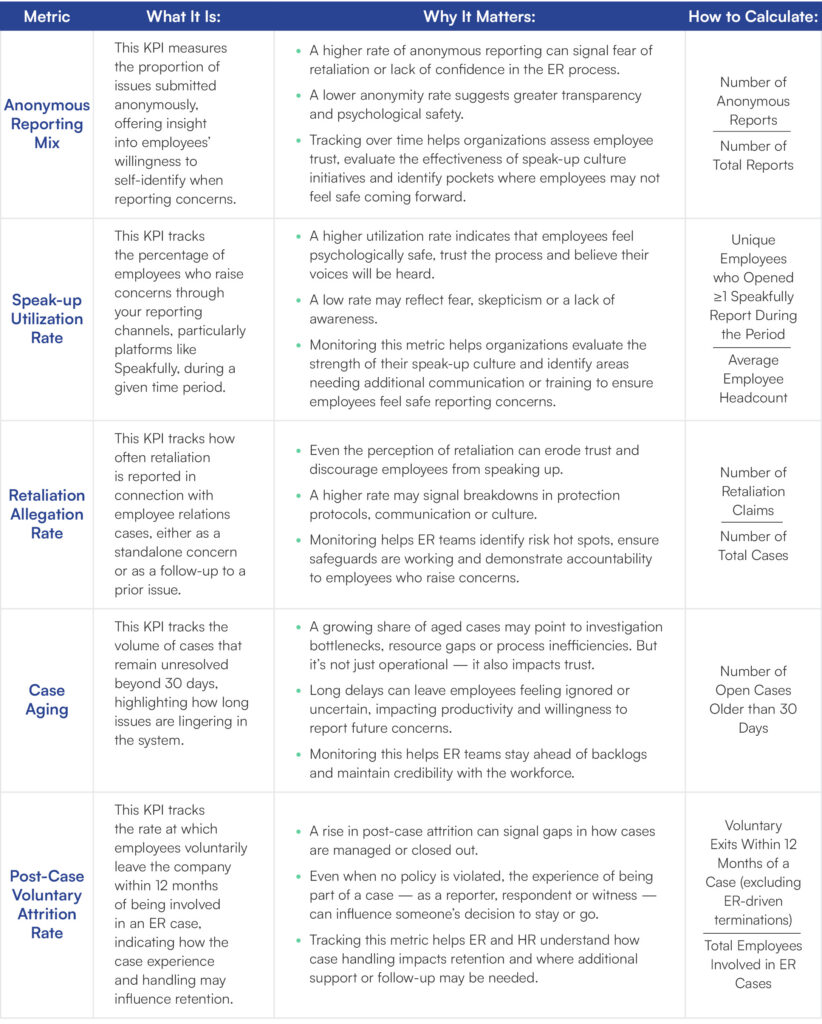
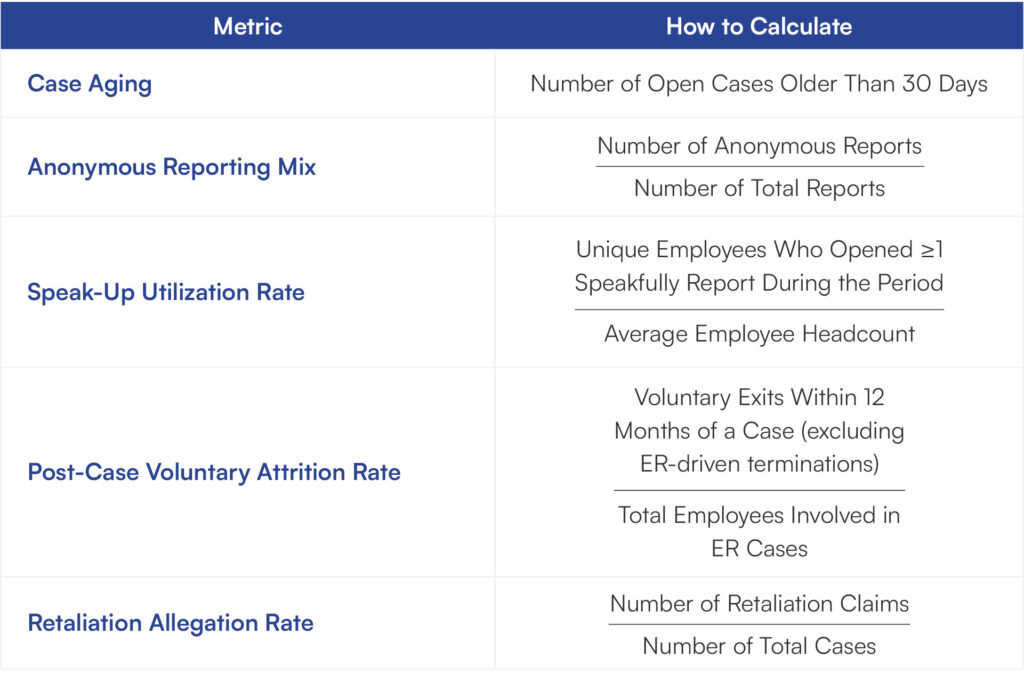
Trust & Experience Metrics
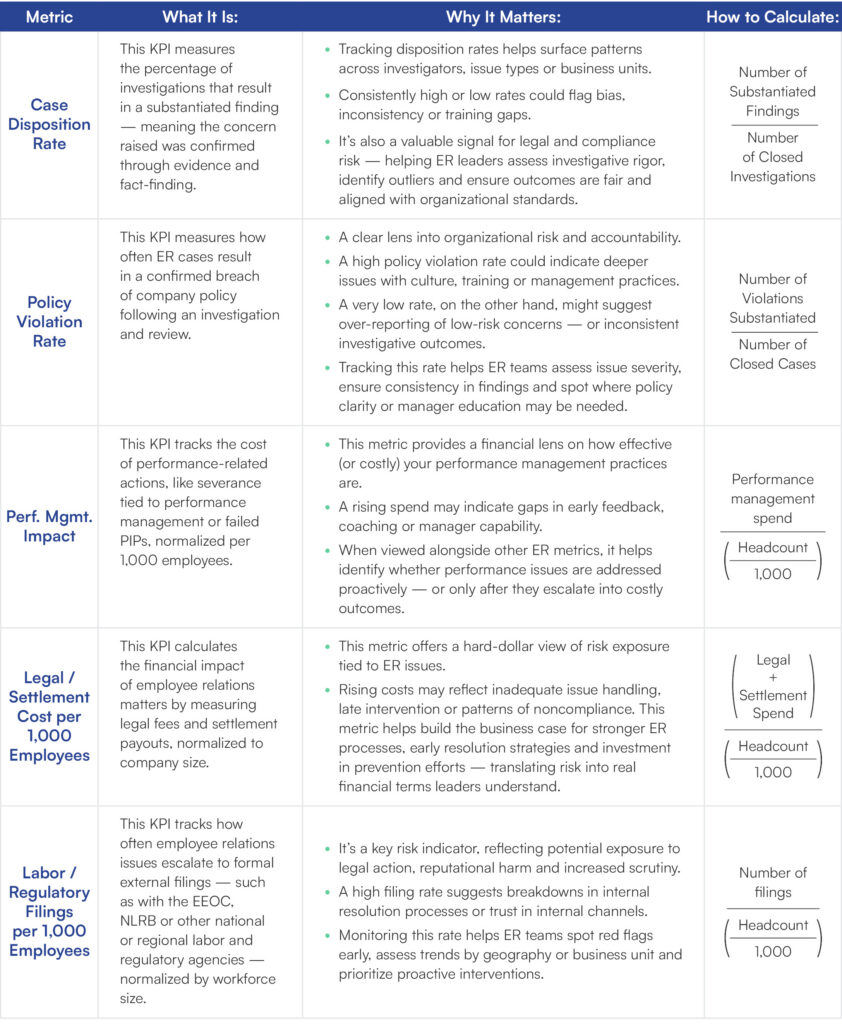
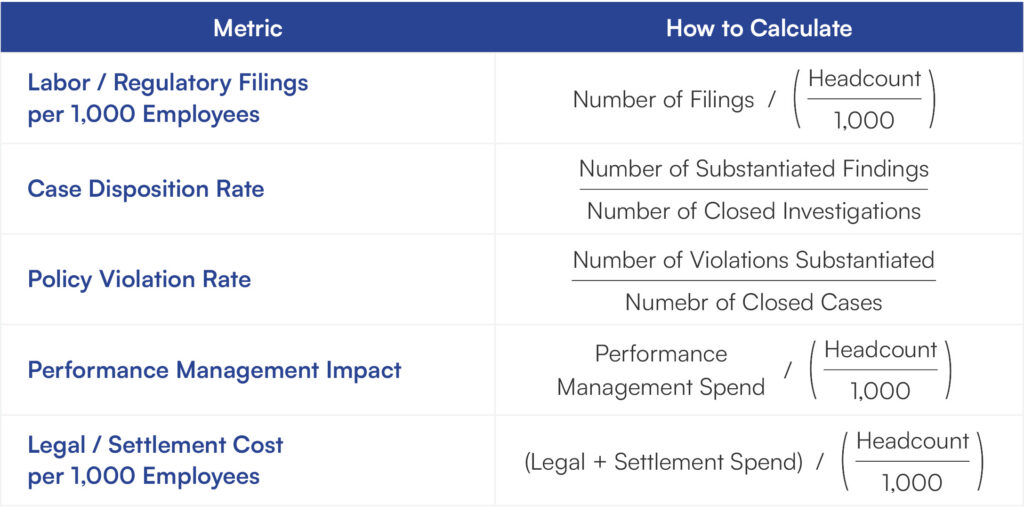
Risk and Compliance Metrics

Getting Started
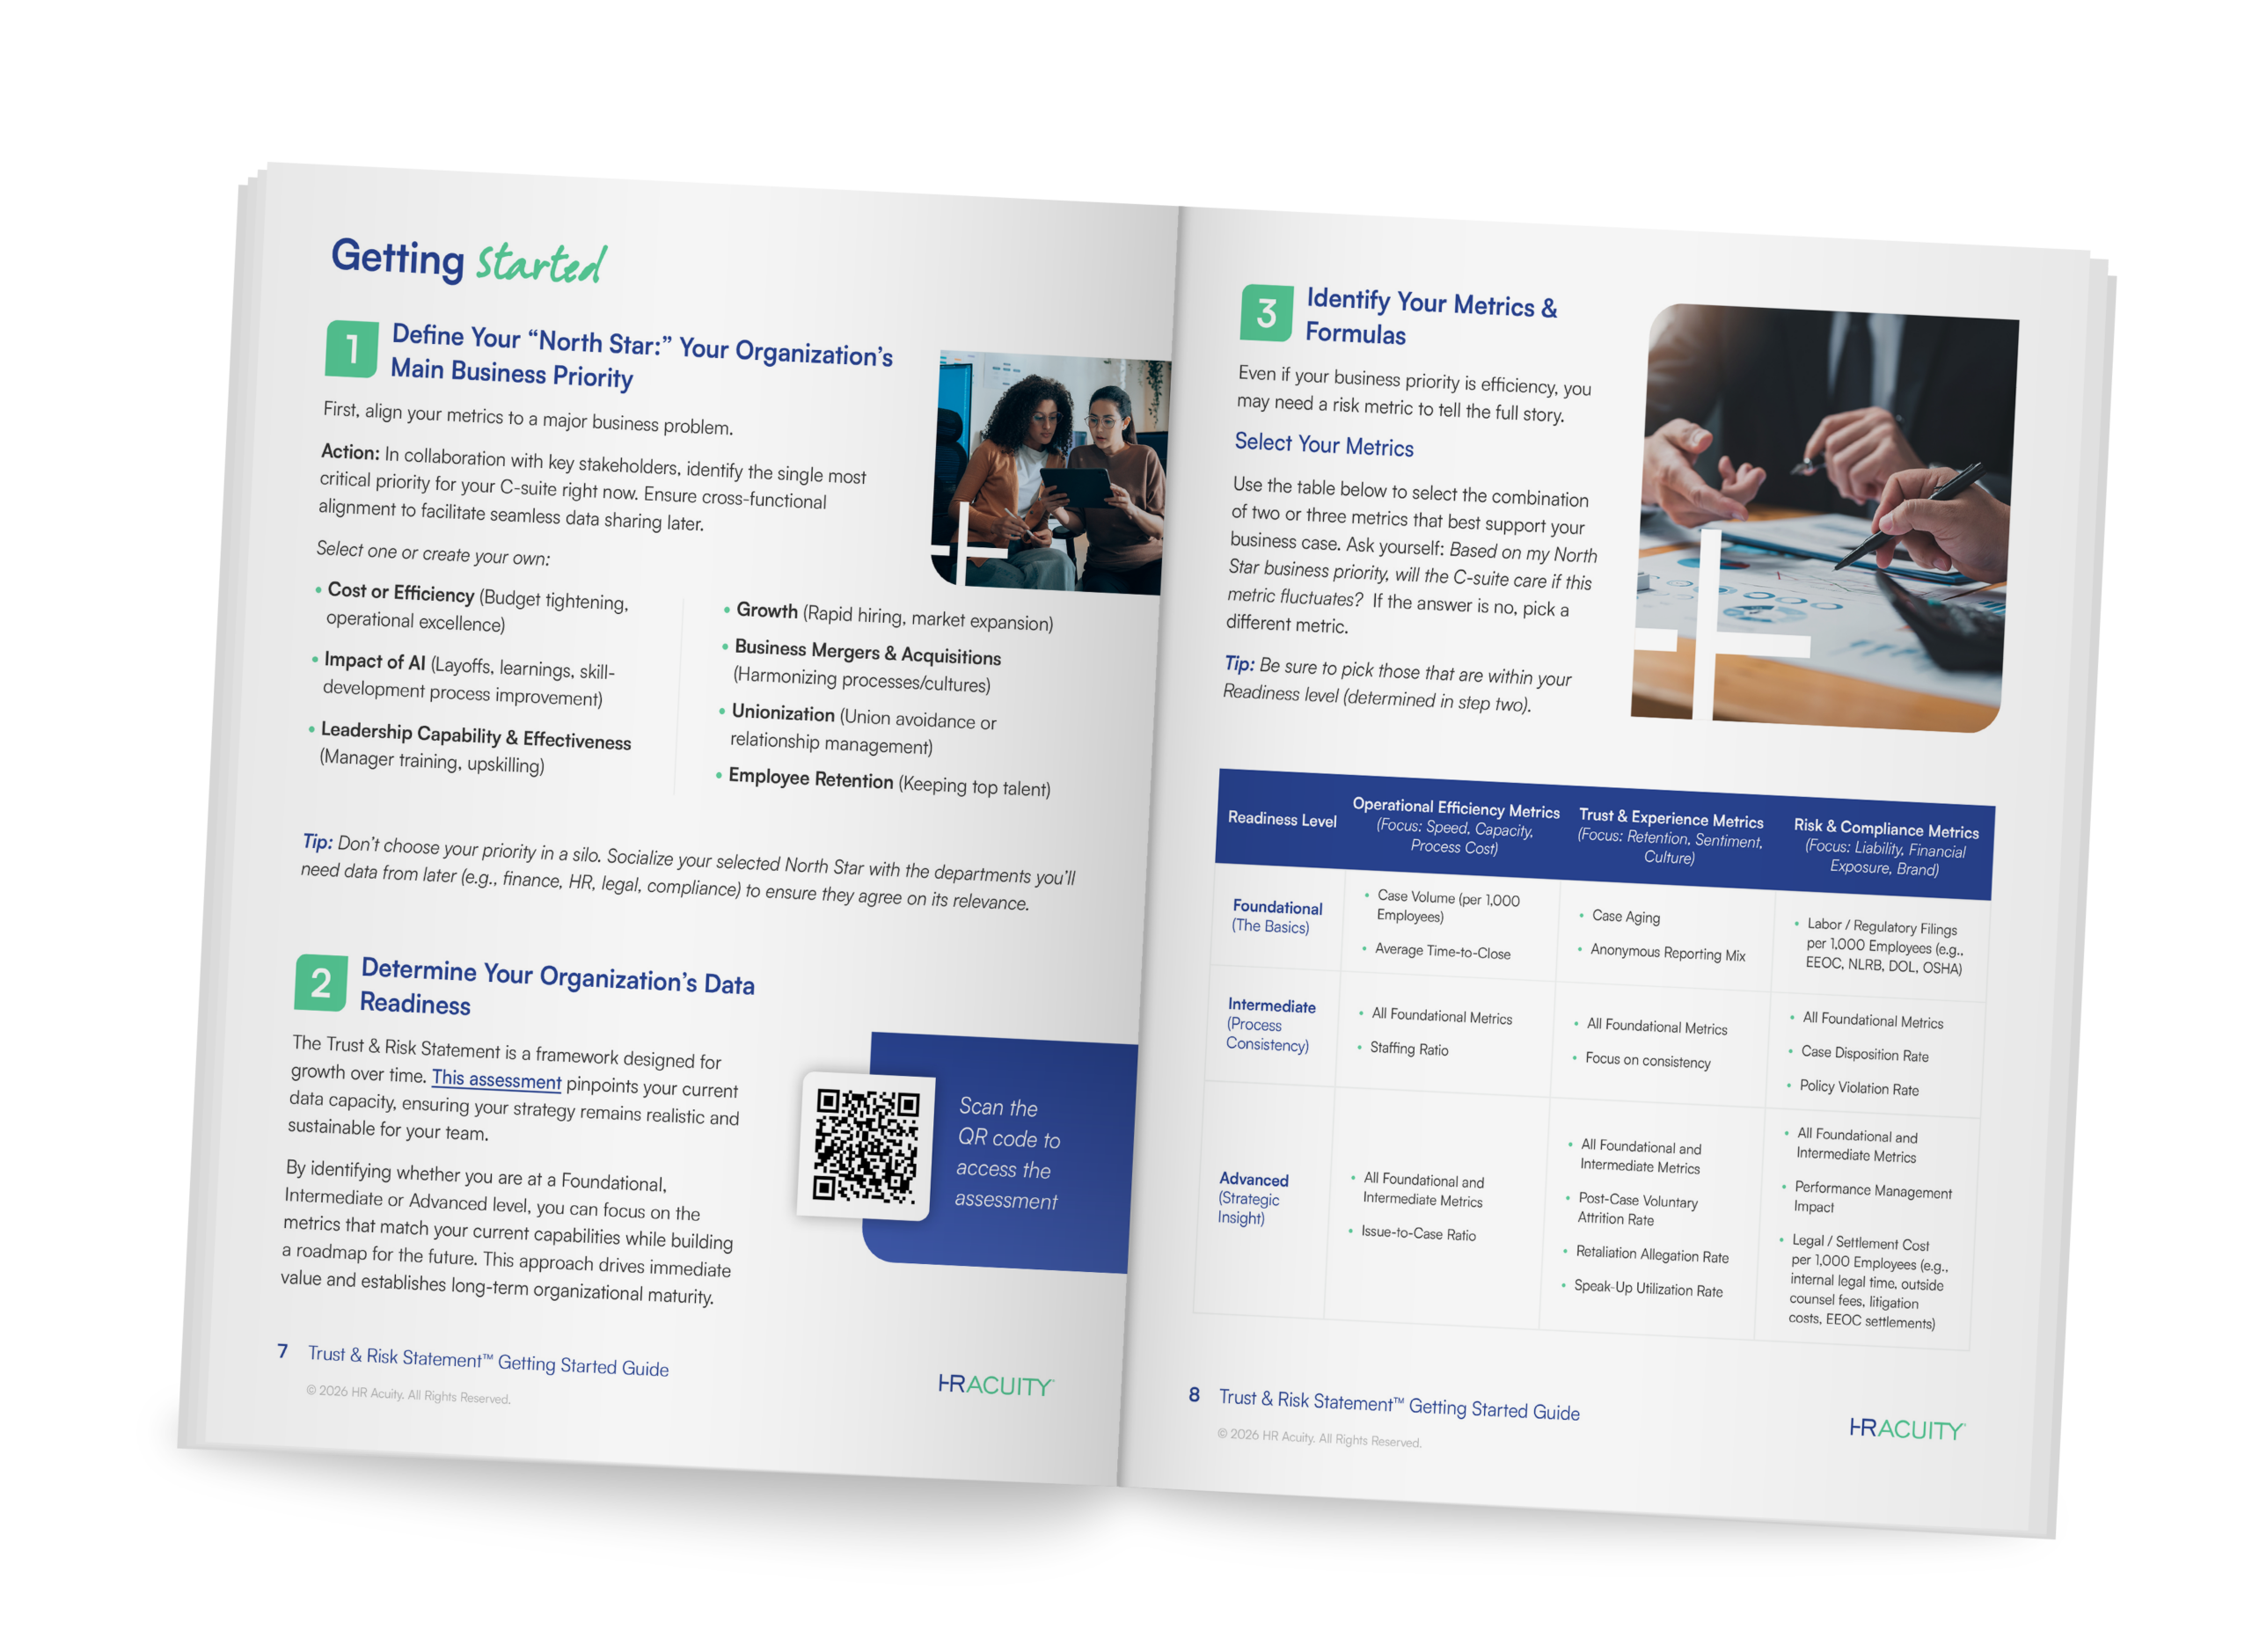
1. Define Your “North Star:” Your Organization’s Main Business Priority
First, align your metrics to a major business problem.
Action: In collaboration with key stakeholders, identify the single most critical priority for your C-suite right now. Ensure cross-functional alignment to facilitate seamless data sharing later.
Select one or create your own:
- Cost or Efficiency (Budget tightening, operational excellence)
- Impact of AI (Layoffs, learnings, skill-development process improvement)
- Leadership Capability & Effectiveness (Manager training, upskilling)
- Growth (Rapid hiring, market expansion)
- Business Mergers & Acquisitions (Harmonizing processes/cultures)
- Unionization (Union avoidance or relationship management)
- Employee Retention (Keeping top talent)
Tip: Don’t choose your priority in a silo. Socialize your selected North Star with the departments you’ll need data from later (e.g., finance, HR, legal, compliance) to ensure they agree on its relevance.
2. Determine Your Organization’s Data Readiness
The Trust & Risk Statement is a framework designed for growth over time. This assessment pinpoints your current data capacity, ensuring your strategy remains realistic and sustainable for your team.
By identifying whether you are at a Foundational, Intermediate or Advanced level, you can focus on the metrics that match your current capabilities while building a roadmap for the future. This approach drives immediate value and establishes long-term organizational maturity.
3. Identify Your Metrics & Formulas
Even if your business priority is efficiency, you may need a risk metric to tell the full story.
Select Your Metrics
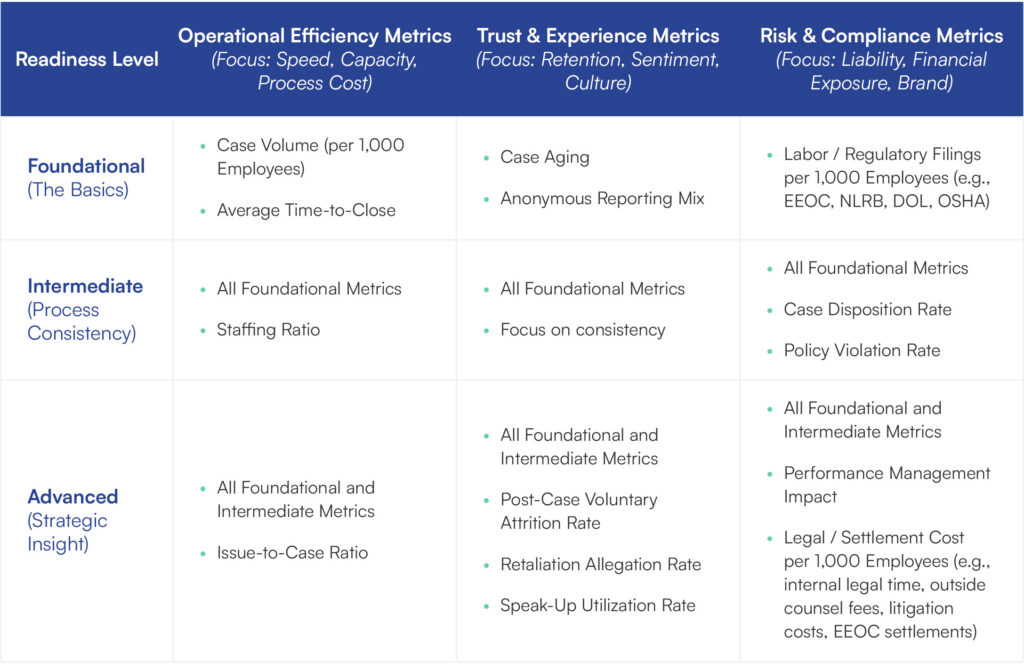
Use the table below to select the combination of two or three metrics that best support your business case. Ask yourself: Based on my North Star business priority, will the C-suite care if this metric fluctuates? If the answer is no, pick a different metric.
Tip: Be sure to pick those that are within your Readiness level (determined in step two).
Find Your Formulas
Once you’ve selected your metrics, review the formulas in the tables below. These reveal the specific data points you will need to audit in step four.
PAUSE: Before you finalize your list, look at the variables in the Calculation Formula column. Do these variables currently exist in the data you track? (For example, if you chose Average Time-to-Close, do you currently track the specific date a case is closed?)
- IF YES: Keep the metric. You will locate the data in step four.
- IF NO: You have two choices:
- Drop it: Choose a simpler metric for now.
- Build it: Keep the metric but understand that you won’t be able to report on it for 90 days while you build a baseline. (For instance, to track Anonymous Reporting Mix, you must start tagging “Anonymous” vs “Named” on every intake starting today to have the data you need in three months’ time.)
Tip: To uncover meaningful baselines, segment your data by case type, region or function. For example, Average Time-to-Close for a routine time and attendance issue shouldn’t be averaged with a complex misconduct investigation. Blending them together hides the insights you need to trend effectively.
Operational Efficiency Metrics
Trust & Experience Metrics
Risk & Compliance Metrics
4. The Data Audit (Breaking Silos)
Now that you have identified the specific data points required, you need to determine who owns them.
Conduct Your Audit
Review the data points from your selected formulas and ask:
Do I own this?
Is this field already trackable in my ER case management system or spreadsheets?
Do I need a partner?
Do I need to ask finance or legal for aggregated legal settlement spend?
Make the Ask
If you need data from another department, frame the request around the North Star you identified in step one.
DON’T SAY: “I need this data for my employee relations report.”
DO SAY: “We are tracking specific risk factors related to [North Star/main business priority], and combining our data will provide the insights needed to drive better business decisions and demonstrate impact to leadership/the organization.”
Checkpoint: The 90-Day Standard
Before you begin reporting on trust and risk, you must validate your baseline. That means to present with confidence, you need at least 90 days of clean, standardized data.
How will you cut the data?
Before proceeding, identify which segments will be most impactful for your organization. To ensure your metrics provide clear signals, your data should be sliced by:
- Function/Department: To pinpoint leadership issues.
- Region: To identify geographic hotspots.
- Case Type: To distinguish between routine issues and high-stakes misconduct.
What scenario best describes your current state?
Scenario A: I have clean, standardized data.
Scenario: You have been tracking the selected data points consistently for over three months.
Action: Proceed to step five. Your data is well-prepared, so you can begin calculating and evaluating trust and risk.
Scenario B: I have the data, but it’s messy.
Scenario: You have the history (such as emails, notes or PDFs), but it isn’t in a spreadsheet or case management system, so you can’t use your data reliably yet.
Action: Perform a historical audit.
- Get started now by blocking off time to manually review your last 20 cases in a certain region, function or case type.
- Enter this data into your new formula to create a retrospective baseline.
- During this period, use the audit to standardize your data and reduce friction for future data tracking. By doing so, you’ll be ready to begin evaluating with confidence in 90 days.
- This will point you in a strong position to proceed to step five.
Scenario C: I don’t have the data.
Scenario: You chose a new metric (such as Time-to-Close), but you never tracked Date Closed in the past. The data simply does not exist.
Action: Enter the baseline or pilot phase.
- Start tracking the data you want to use to measure trust and risk. Take this opportunity to share your plan with internal stakeholders, letting them know what you’ll be measuring, how you’ll track it and when they can expect updates.
- Provide brief updates on your progress to stay aligned and demonstrate value. For example: “We have established new tracking protocols and will have our first quarterly baseline on [date].”
- Proceed to step five to practice your routine and refine your process, but keep the data internal until you reach the 90-day mark.
5. Analyze the Results
Don’t just report the number. Determine if/how it matters. That’s what will get your executive leadership team’s attention.
Calculate: Apply the formulas from step three to your data set.
Benchmark: Compare your results against the previous quarter, industry benchmarks and goals.
If this is your first time tracking, this number is your baseline. You will compare future quarters against this.
Tip: Small variations (<5%) are usually noise. Look for significant shifts.
- Hypothesize:
Diagnose the movement. - High number?
Does it mean a toxic culture or simply higher trust in the reporting system? - Low number?
Is the environment healthy or is there a fear of retaliation? - The goal:
Formulate a clear theory on why the data moved before you present it.
Plan Action: Identify the areas where improvement is needed and outline initiatives to address them. With continued monitoring, you’ll be able to gauge the effectiveness of employee relations interventions.
6. Build the Narrative
Use this framework to structure your executive summary, email or slide.
- The Priority: “To support the organization’s focus on [North Star from step one]…”
- The Data: “…we are tracking [metric name] to identify potential friction.”
- The Analysis: “Current data shows a [trend: spike/drop] in [department/region], suggesting [hypothesis from step five].”
- The Solution: “ER is addressing this by [specific intervention] to mitigate risk and support business continuity.”
Putting the Framework into Practice
Employee relations work is already shaping trust and risk every day, whether it is measured or not. The Trust & Risk Statement simply makes that impact visible. By starting where you are and applying the framework with discipline, you initiate a virtuous cycle: As we provide greater clarity, our organizations rely more heavily on our expertise, leading to deeper impact over time.
As we build this muscle together, we move the entire discipline of employee relations forward, strengthening our broader community of practice and ensuring the function is recognized as the strategic pillar it truly is.
You don’t have to do this alone.
To see how fellow employee relations leaders are leveraging these metrics and to get hands-on support, check out these helpful resources.
empowER™ Community Trust & Risk Group