Skip to content

NEW! Our 2025 Workday Misconduct Study is here

READ NOW

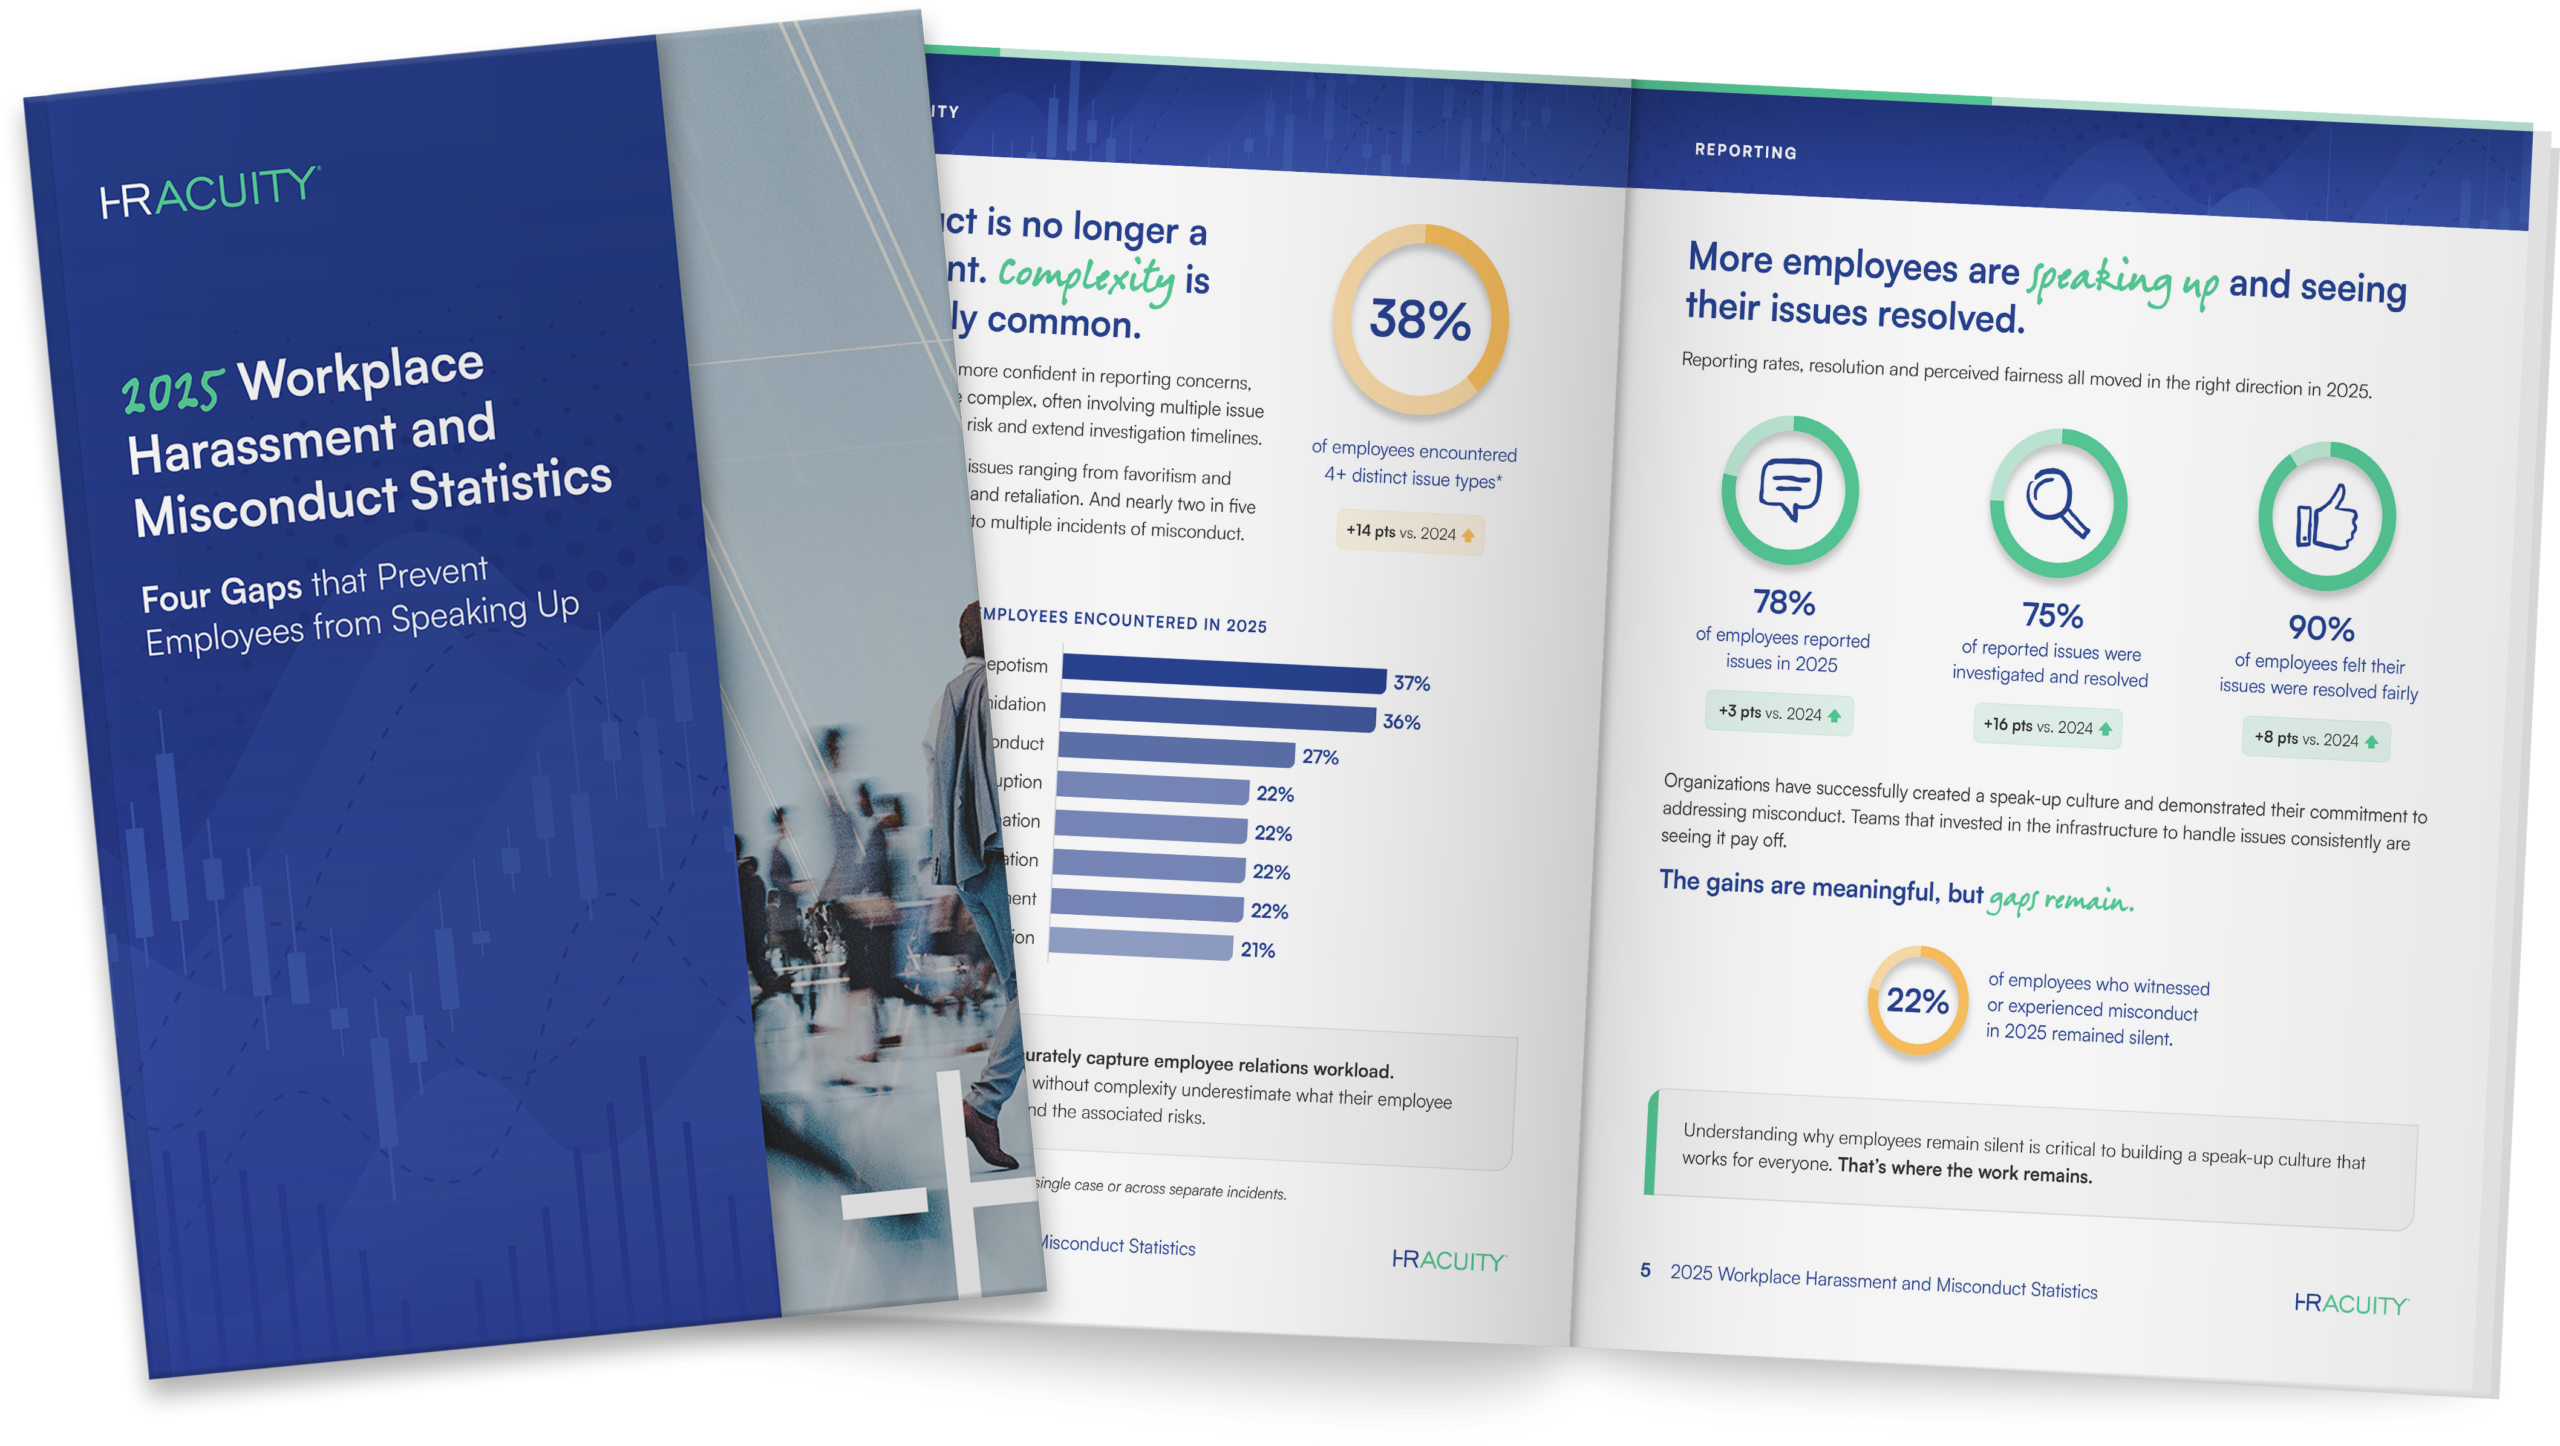
2025 Workplace Harassment and Misconduct Statistics: Four Gaps that Prevent Employees from Speaking Up

With data from over 2,000 U.S.-based employees, this report uncovers what’s driving a surge in allegations, why some employees still don’t speak up and how organizations can build and maintain employee trust.

Research conducted by HR Acuity in collaboration with Isurus Research
What happens after an employee comes forward matters more than most realize. It shapes whether others report, whether leadership can be trusted to do the right thing and whether employees stay. HR Acuity surveyed over 2,000 employees to find out what they’re experiencing and what separates organizations that get it right from those that don’t.
2025 Workplace Harassment and Misconduct Statistics
Read the Report

Workplace misconduct hit a near seven-year high.

In the years following #MeToo, organizations invested in the structural foundations of employee relations, including stronger processes, updated policies and expanded training. Progress followed. Misconduct rates fell 15 points over five years.

Then 2025 happened. 55% of employees experienced or witnessed misconduct, a near seven-year high, signaling that structural foundations are not enough. Lasting change depends on employees feeling safe to raise concerns and seeing issues investigated, resolved and addressed with accountability.

Vertical bar chart titled "Harassment & Misconduct Rates by Year" showing four data points across non-consecutive years. The 2019 bar (navy blue) shows 56%. The 2023 bar (teal/green) shows 52%. The 2024 bar (dark navy) shows the lowest rate at 41%. The 2025 bar (gold/orange) shows 55%, with an annotation indicating a +14 point increase from 2024 to 2025, marked with an upward arrow. The chart illustrates a notable single-year spike after a period of decline.

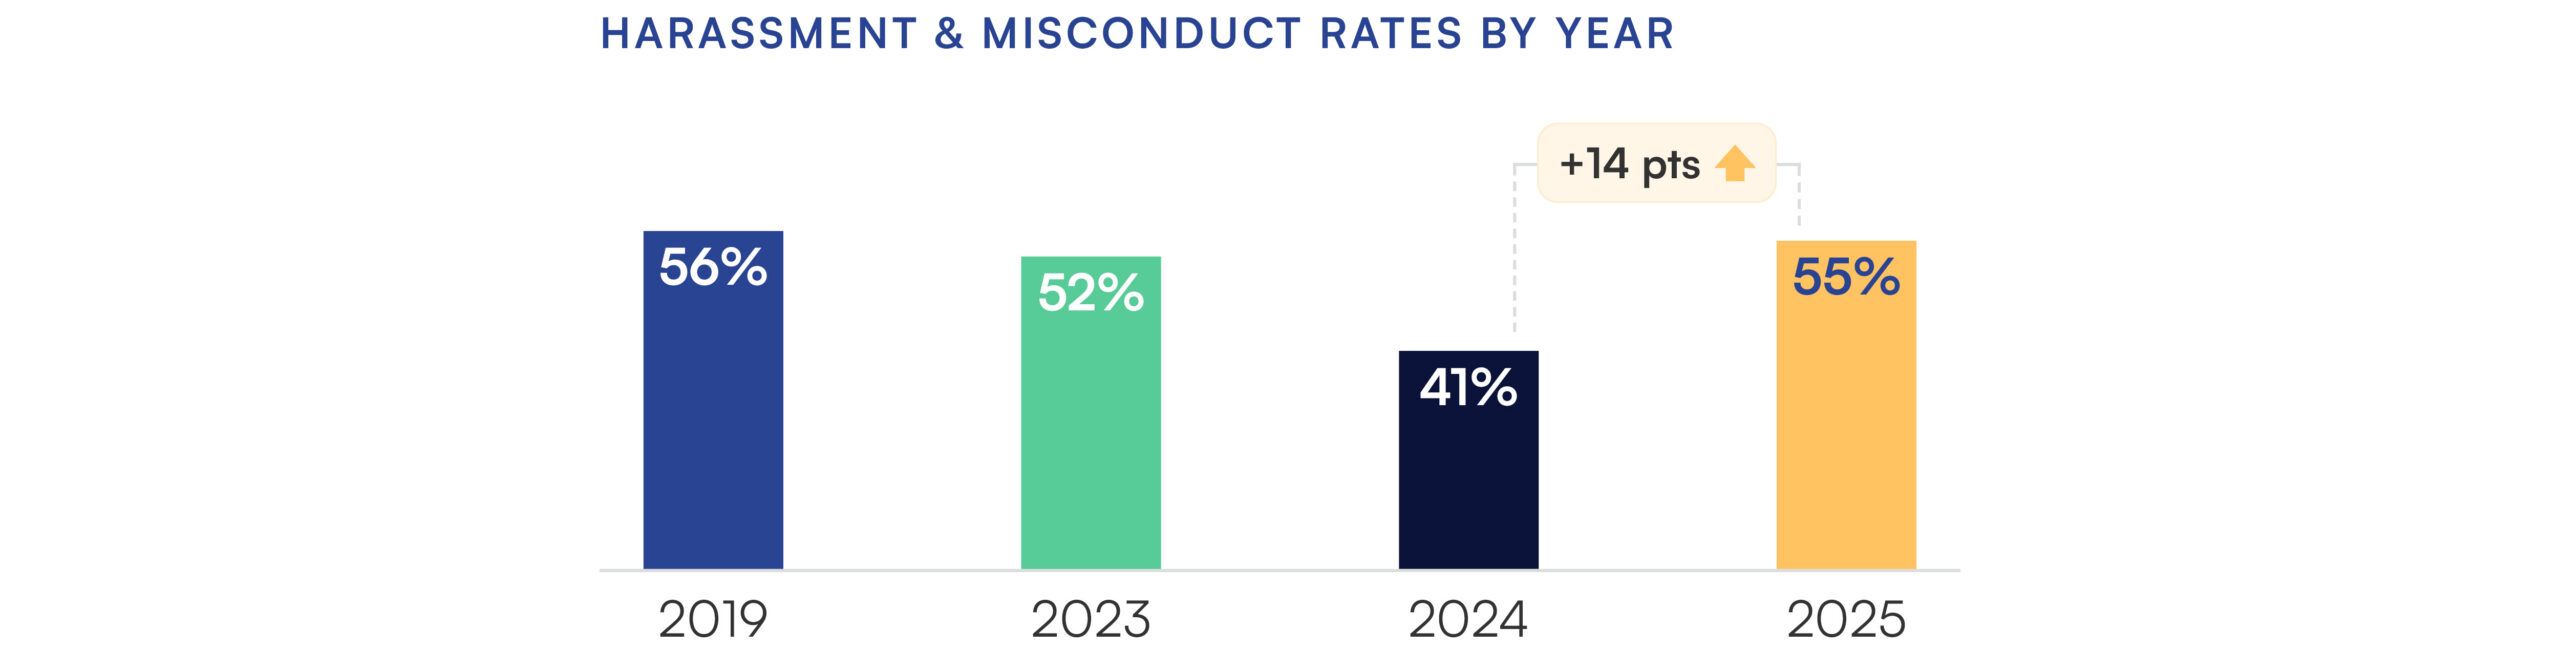
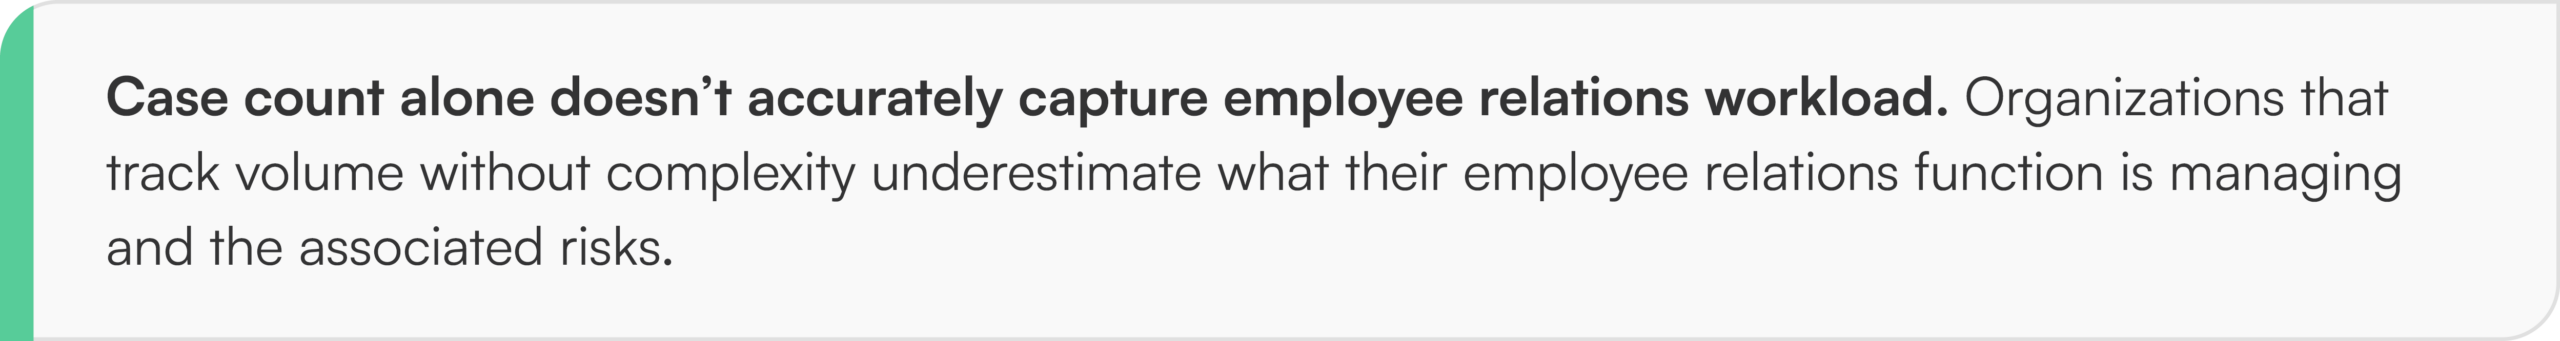
The single-year 14-point jump means more cases entering the system, more investigations to staff and more employees waiting for a response. For a function already stretched thin, increased volume alone is a liability.

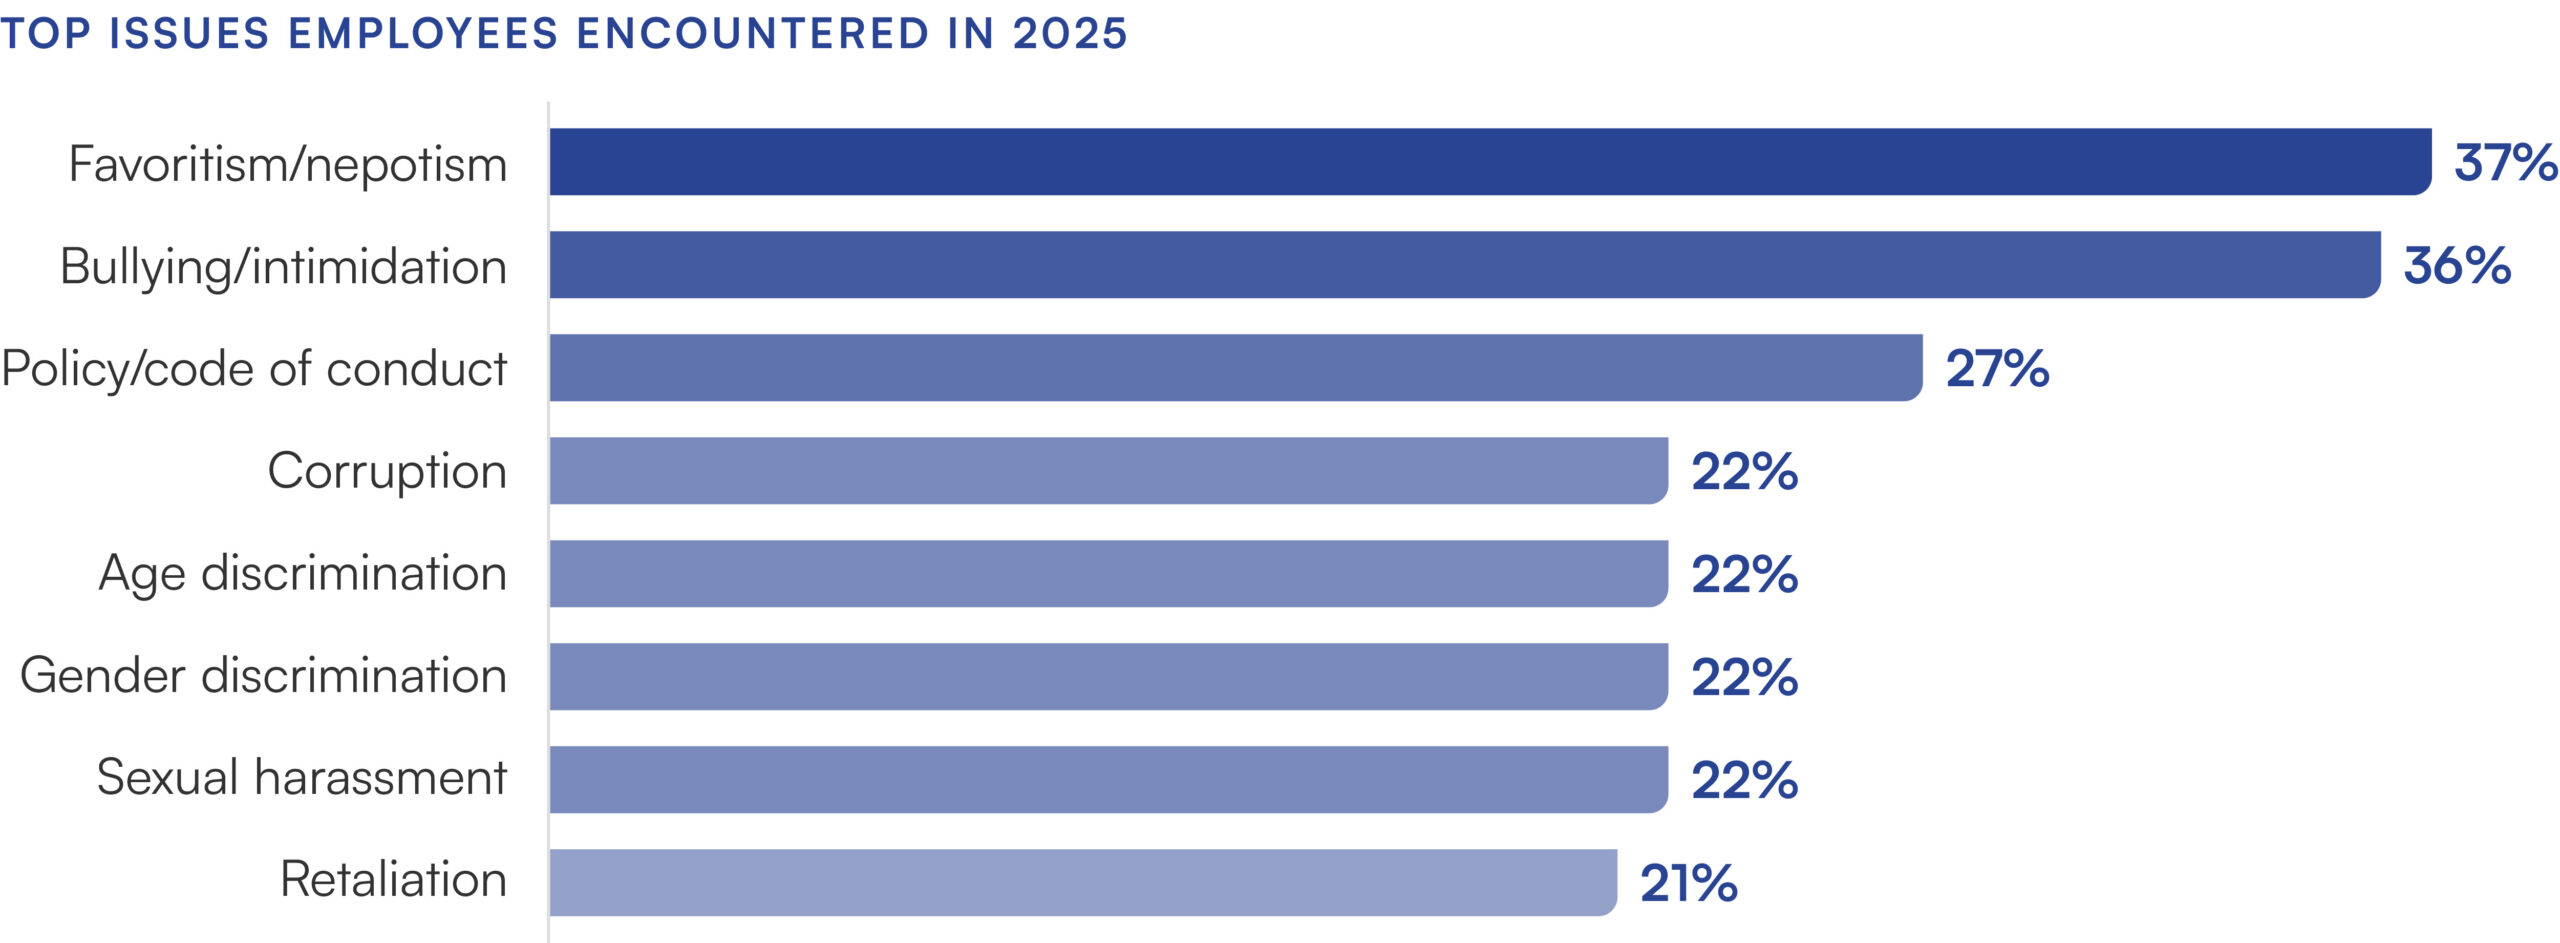
Misconduct is no longer a single event. Complexity is increasingly common.

As employees become more confident in reporting concerns, cases are growing more complex, often involving multiple issue types that increase legal risk and extend investigation timelines.

Employees are reporting issues ranging from favoritism and bullying to discrimination and retaliation. And nearly two in five employees were exposed to multiple incidents of misconduct.

Image says 38% of employees encountered 4+ distinct issue types, 14 point increase vs. 2024.
Horizontal bar chart titled "Top Issues Employees Encountered in 2025." Eight workplace issues are listed from highest to lowest percentage. Favoritism/nepotism is the most reported at 37%, followed closely by bullying/intimidation at 36%. Policy/code of conduct issues follow at 27%. Four issues are tied at 22%: corruption, age discrimination, gender discrimination, and sexual harassment. Retaliation rounds out the list at 21%. The top two bars are dark navy blue; the remaining bars are light periwinkle blue.
Case count alone doesn’t accurately capture employee relations workload. Organizations that track volume without complexity underestimate what their employee relations function is managing and the associated risks.

*This may include multiple issue types within a single case or across separate incidents.

Reporting rates, resolution and perceived fairness all moved in the right direction in 2025.

Three circular donut charts displaying 2025 workplace reporting and resolution metrics, each showing year-over-year improvement versus 2024. The first chart, represented by a speech bubble icon, shows 78% of employees reported issues in 2025, up 3 percentage points from 2024. The second chart, represented by a magnifying glass icon, shows 75% of reported issues were investigated and resolved, up 16 percentage points from 2024. The third chart, represented by a thumbs up icon, shows 90% of employees felt their issues were resolved fairly, up 8 percentage points from 2024. All three charts use a teal/green progress ring on a light green background, with upward-arrow indicators highlighting the year-over-year gains.

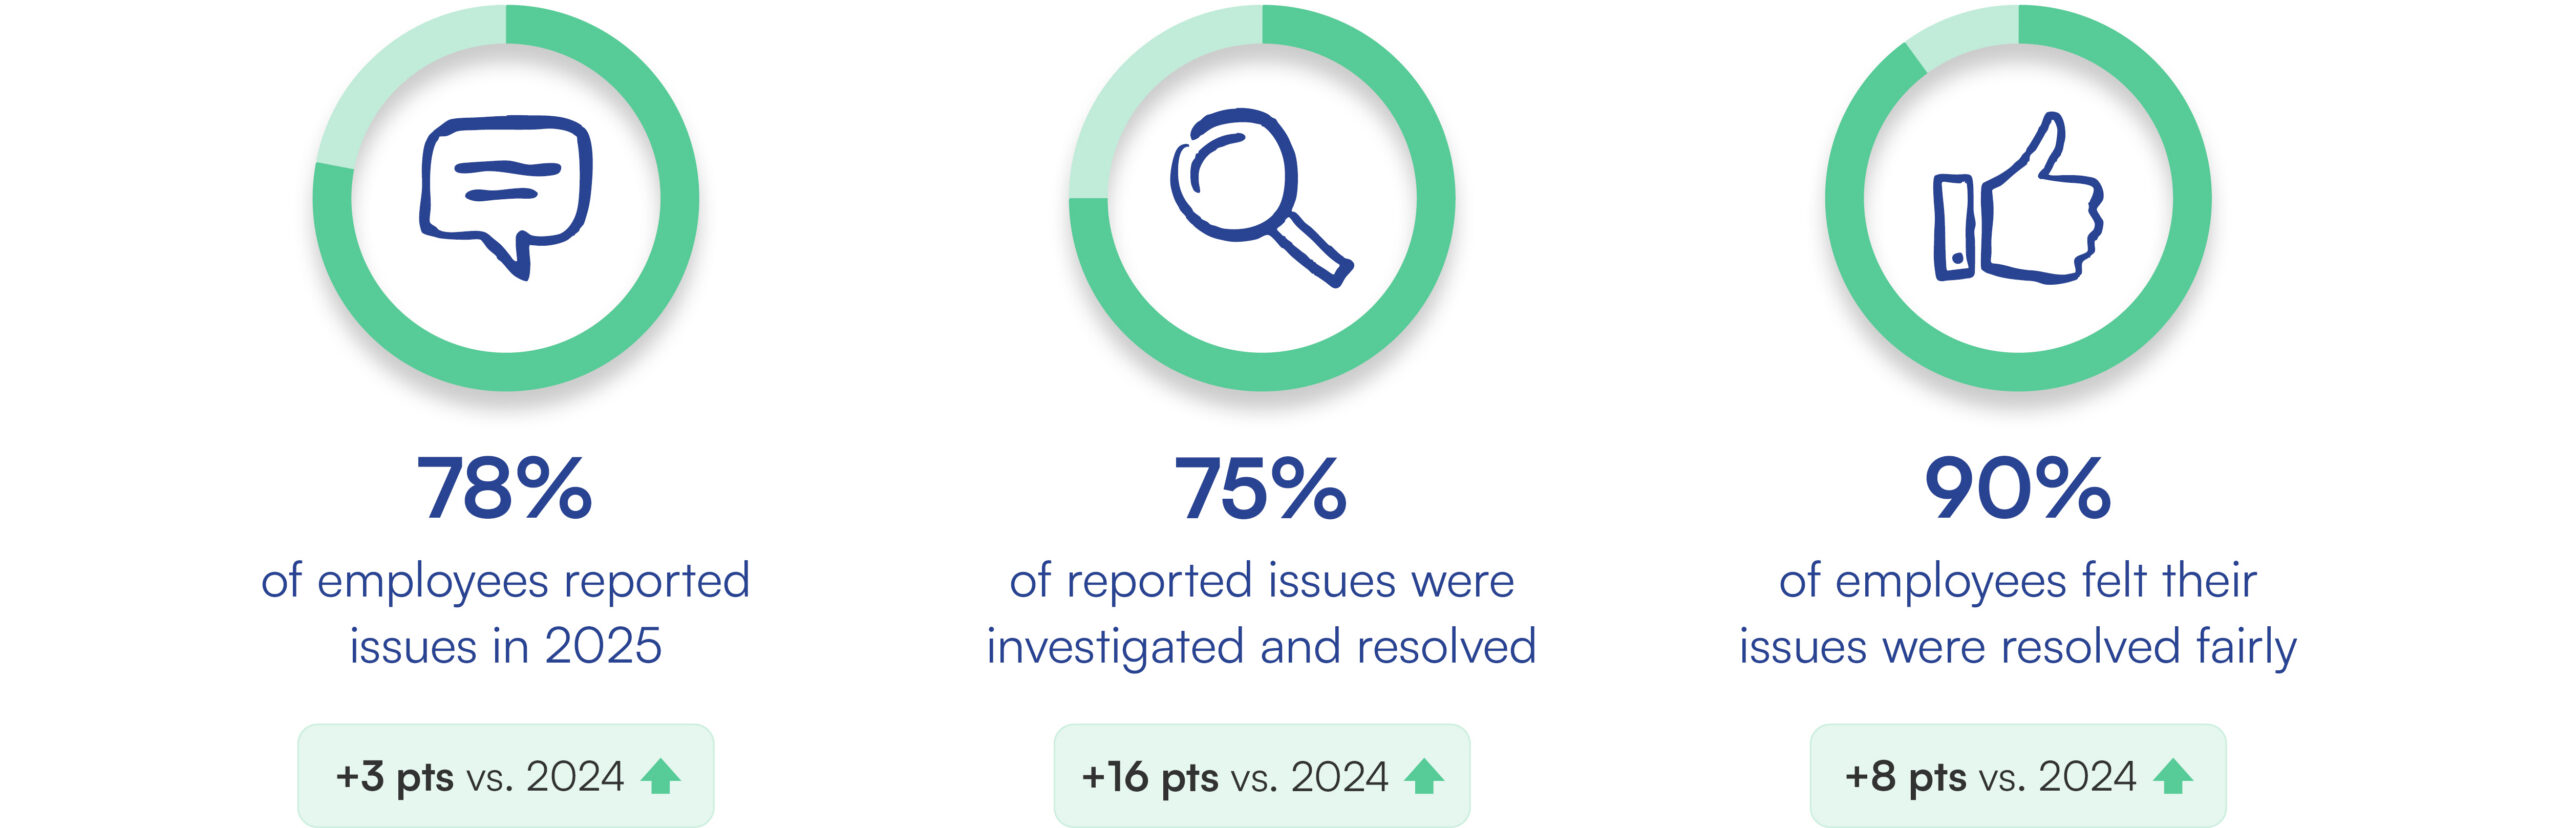
Organizations have successfully created a speak-up culture and demonstrated their commitment to addressing misconduct. Teams that invested in the infrastructure to handle issues consistently are seeing it pay off.

The gains are meaningful, but gaps remain.

22% of employees who witnessed or experienced misconduct in 2025 remained silent.
Understanding why employees remain silent is critical to building a speak-up culture that works for everyone. That’s where the work remains.

Beyond the progress, four gaps show where reporting still falls short.

The overall reporting rate obscures more than it reveals. Unreported misconduct concentrates in certain environments, among certain groups of employees and around distinct fears.

Misconduct most often occurs in the office...where it is least reported.

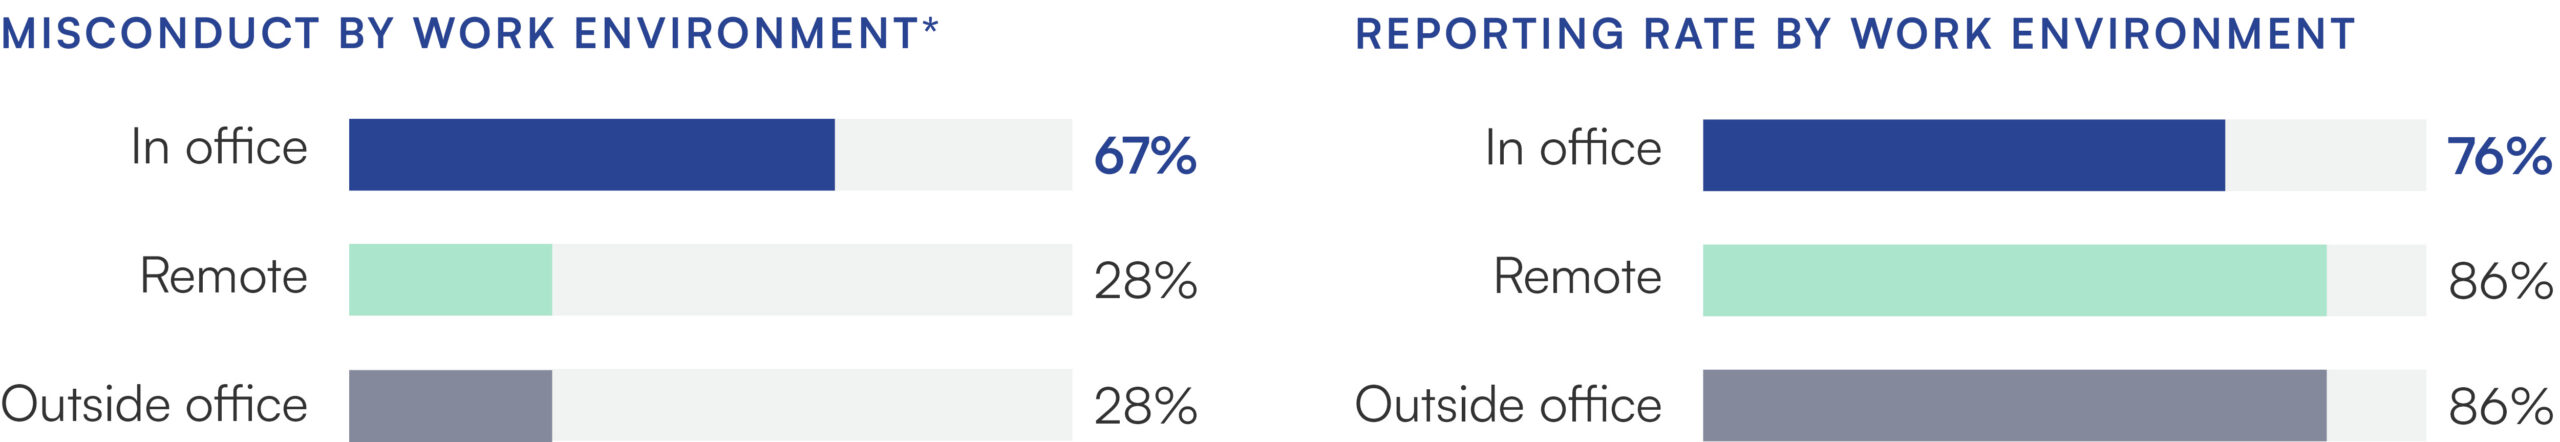
As more organizations shift back to in-office work, the reporting gap carries more weight than it appears. This is because misconduct is most prevalent when employees work in person.

Two horizontal bar charts displayed side by side. The left chart, titled "Misconduct by Work Environment," shows in-office at 67% (dark navy bar), remote at 28% (teal/green bar), and outside office at 28% (gray bar). The right chart, titled "Reporting Rate by Work Environment," shows in-office at 76% (dark navy bar), remote at 86% (teal/green bar), and outside office at 86% (gray bar). Together the charts illustrate that while misconduct occurs most frequently in office settings, employees in remote and outside-office environments report misconduct at a higher rate than their in-office counterparts.
Culture becomes both the context for harm and the barrier to addressing it. Organizations that understand where and why reporting breaks down and can target interventions where they’ll actually have impact.

*Multiple responses were accepted.


Hourly worker issues are both underreported and least investigated.

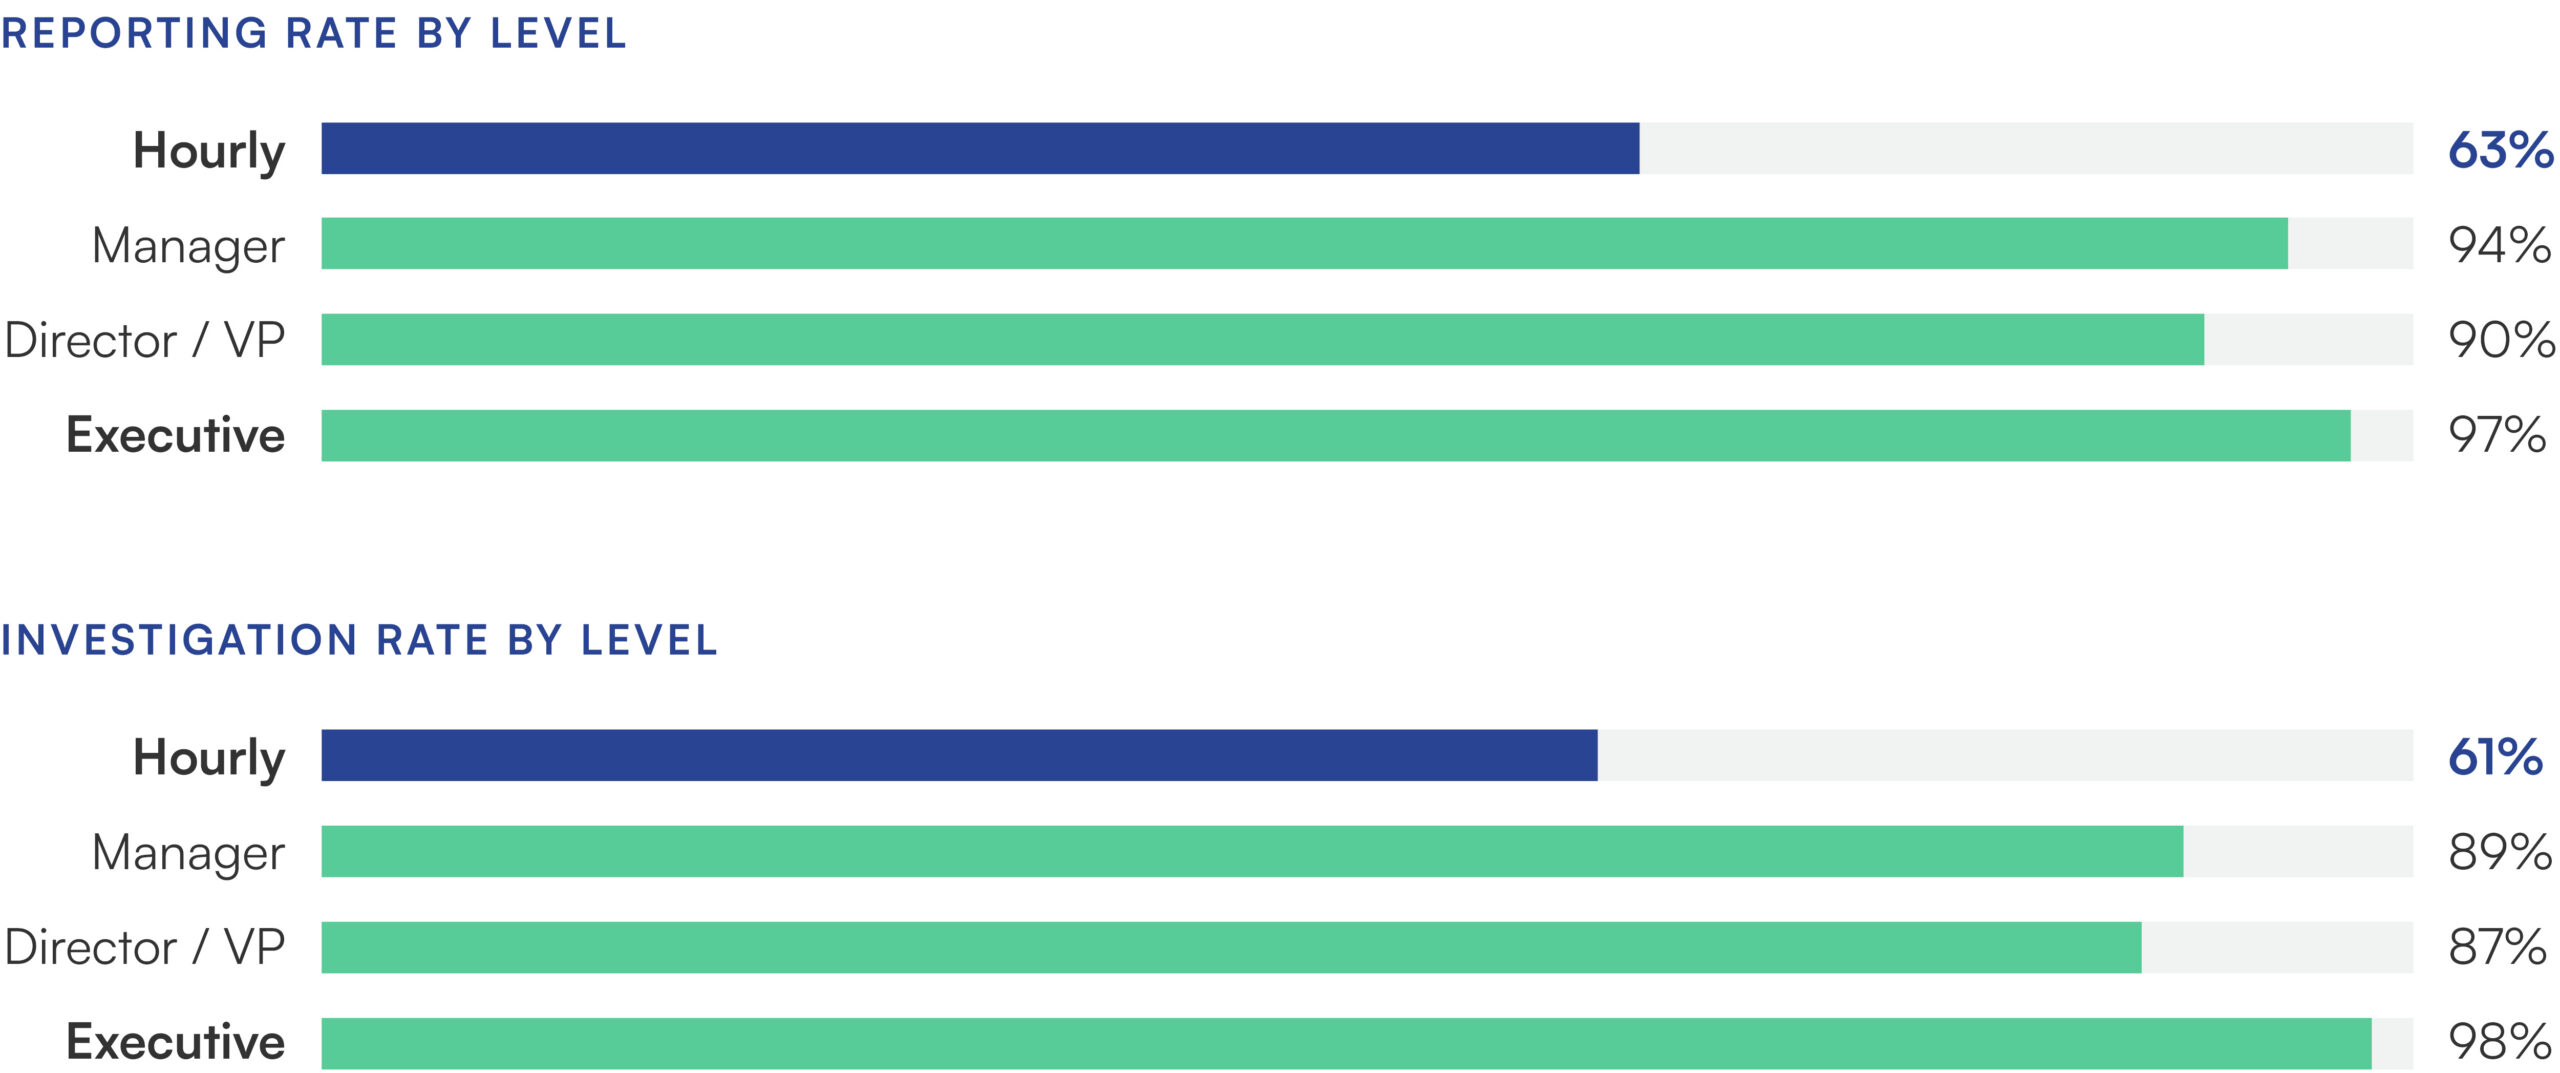
When issues go uninvestigated, employees stop raising them. For hourly workers, that’s already happening on both counts.


Two horizontal bar charts stacked vertically, both broken down by four employee levels. The top chart, titled "Reporting Rate by Level," shows hourly workers at 63% (dark navy bar), managers at 94% (teal/green bar), directors/VPs at 90% (teal/green bar), and executives at 97% (teal/green bar). The bottom chart, titled "Investigation Rate by Level," follows a similar pattern: hourly at 61% (dark navy bar), managers at 89% (teal/green bar), directors/VPs at 87% (teal/green bar), and executives at 98% (teal/green bar). In both charts, hourly employees are highlighted in bold and shown in navy blue to emphasize their notably lower rates compared to all other employee levels, which are displayed in teal/green.
Investigating every concern closes the gap and builds confidence. When employees don’t believe speaking up will lead anywhere, they won’t. Hourly employees need to know what qualifies as misconduct, how to report it, that they can do so anonymously and that their concerns will be taken seriously. Train managers to recognize, receive and escalate issues instead of handling them informally.

Anonymous reporting only works if employees know it exists.

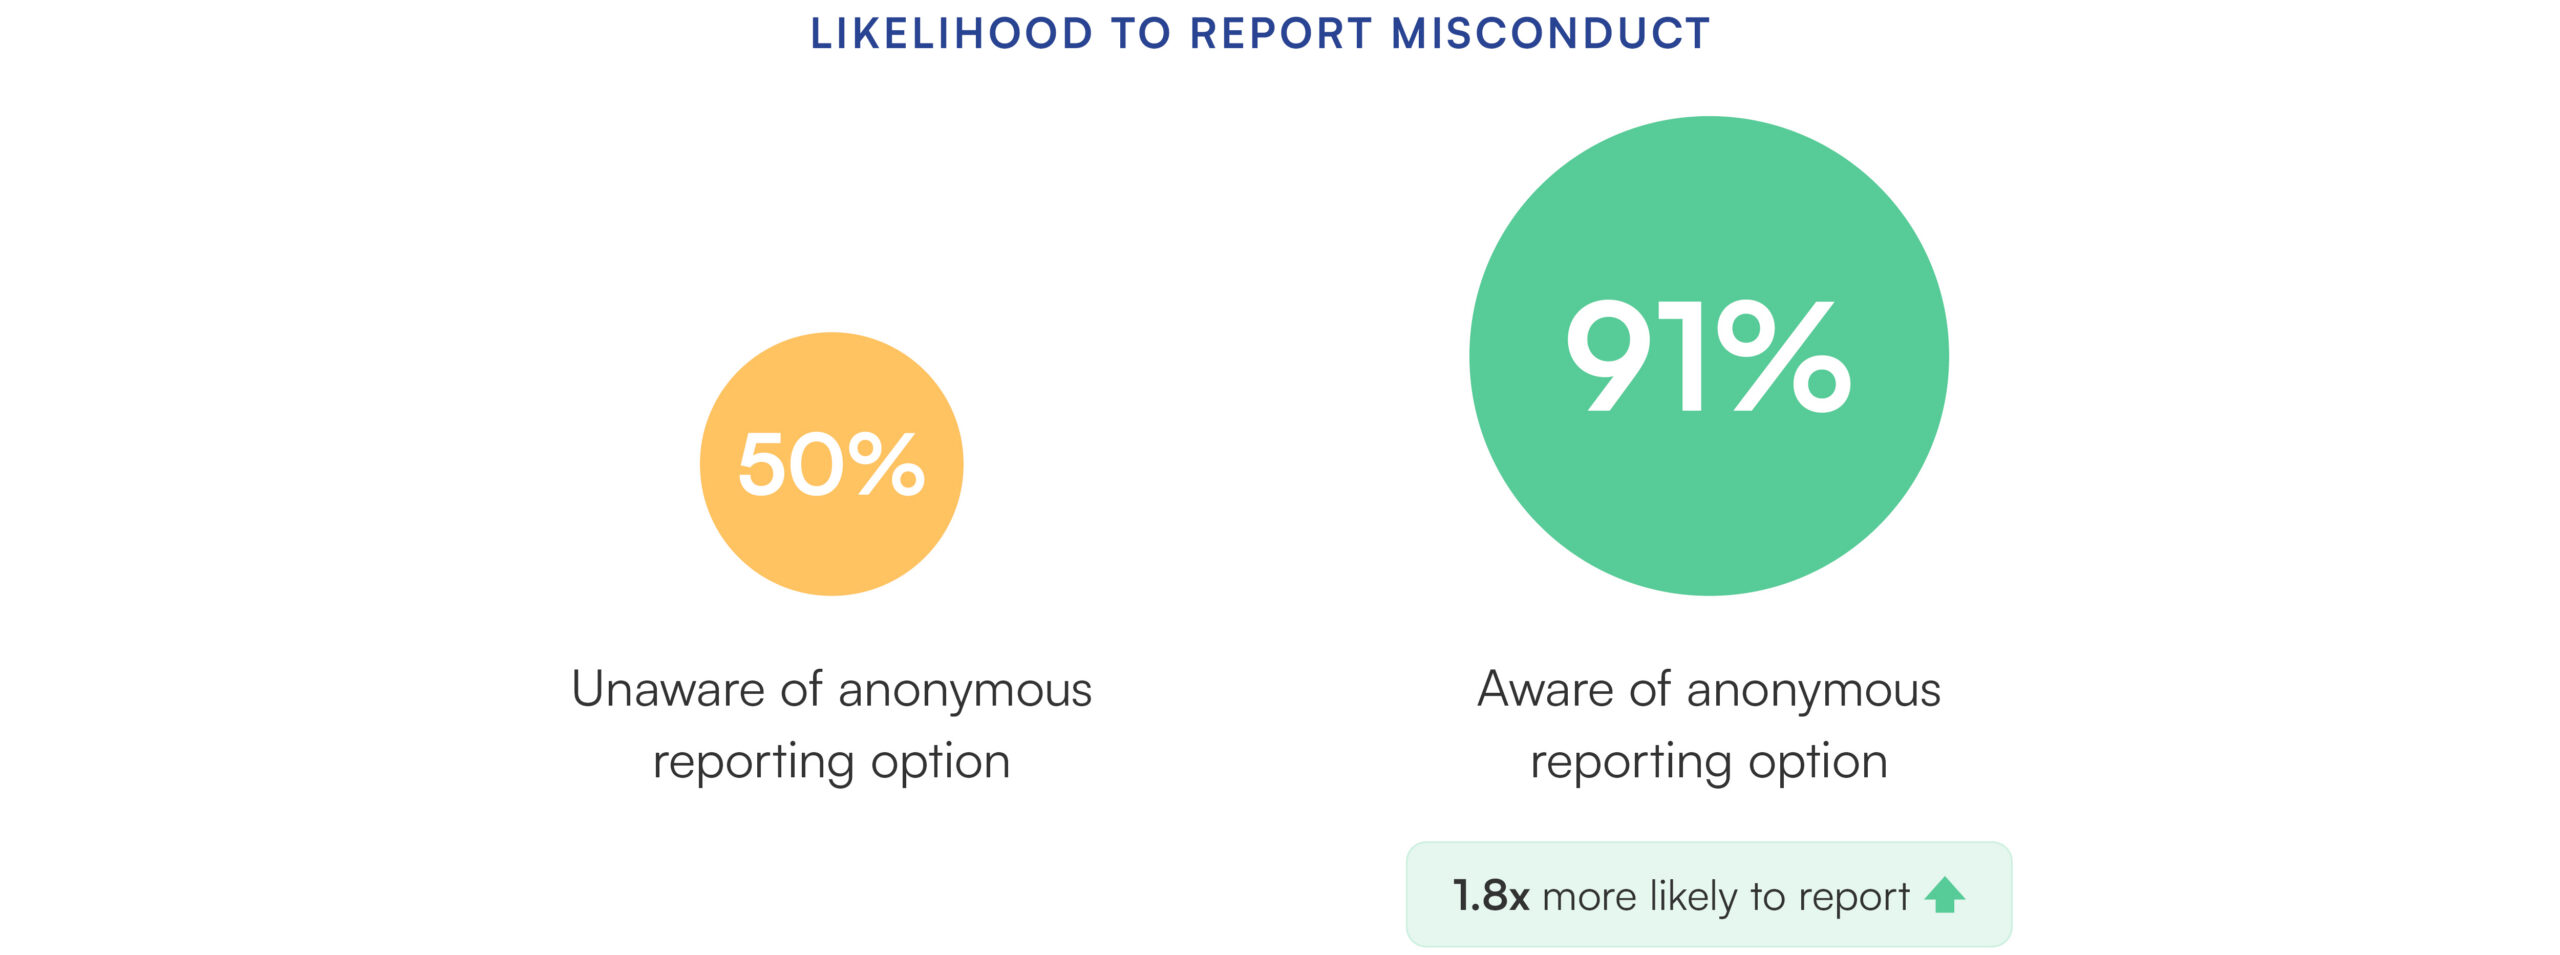
When it comes to anonymous reporting, there’s a clear disconnect between what employers provide and what employees know about. According to HR Acuity’s Annual Employee Relations Benchmark Study, nearly all organizations provide anonymous reporting tools, yet only 56% of employees are aware this option exists.

When employees know they can report anonymously, they do so at nearly double the rate.

Two circles of different sizes illustrating likelihood to report misconduct based on awareness of anonymous reporting. A smaller gold/yellow circle on the left shows 50% — representing employees unaware of the anonymous reporting option. A larger teal/green circle on the right shows 91% — representing employees aware of the anonymous reporting option. The size difference between the circles visually reinforces the gap. A teal badge beneath the larger circle highlights that employees aware of the option are 1.8x more likely to report misconduct, indicated by an upward arrow.
Employees need to know that when they speak up, their employer will act. Organizations that actively communicate anonymous reporting and back it up with a clear, credible process are the ones employees trust. When employees trust the process and that action will follow, they’re more inclined to report.

Fear of retaliation silences employees and undermines reporting culture.

Retaliation thrives in environments where power imbalances go unchecked, accountability is inconsistent and past incidents fester. Employees notice. When they watch peers experience negative consequences for reporting, the message is clear: Speaking up carries a cost. For many, it’s not worth the risk.

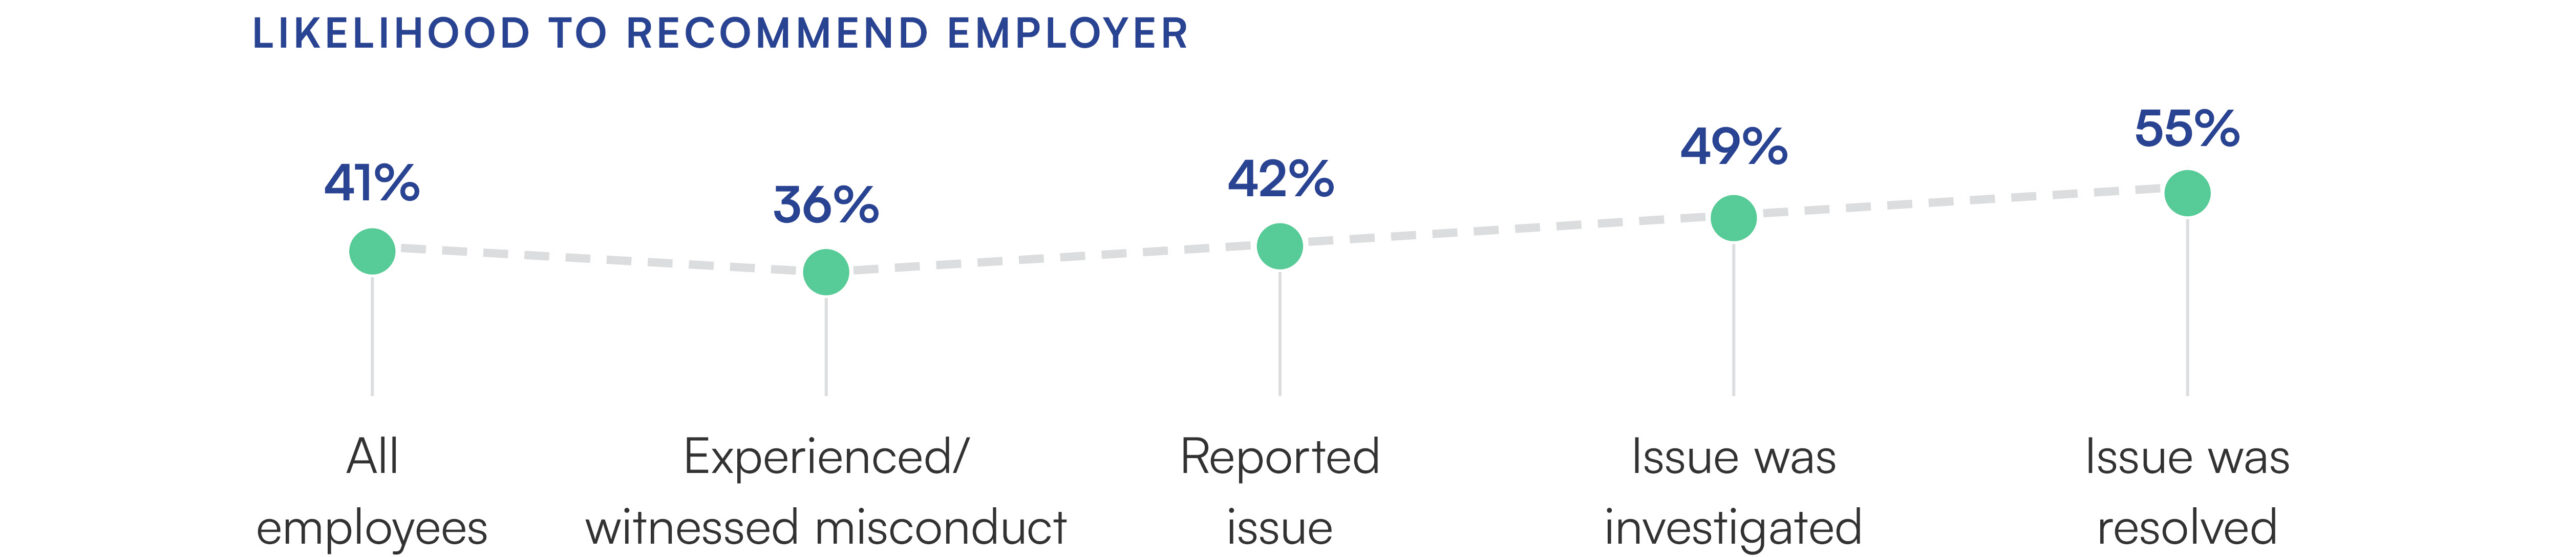
Misconduct tests trust. A strong response can do more than restore it.

Misconduct happens. And when it does, trust takes a hit — that’s expected. But what happens next is in your control.

Two navy blue donut charts displayed side by side inside a bordered box. The left chart shows 65% in the center, with the label "of employees who experienced misconduct and left said it was a factor." The right chart shows 55% in the center, with the label "of employees say trust in their employer declined after facing misconduct." Both charts use a dark navy blue progress ring against a light gray background, visually emphasizing the majority of employees affected in each category.

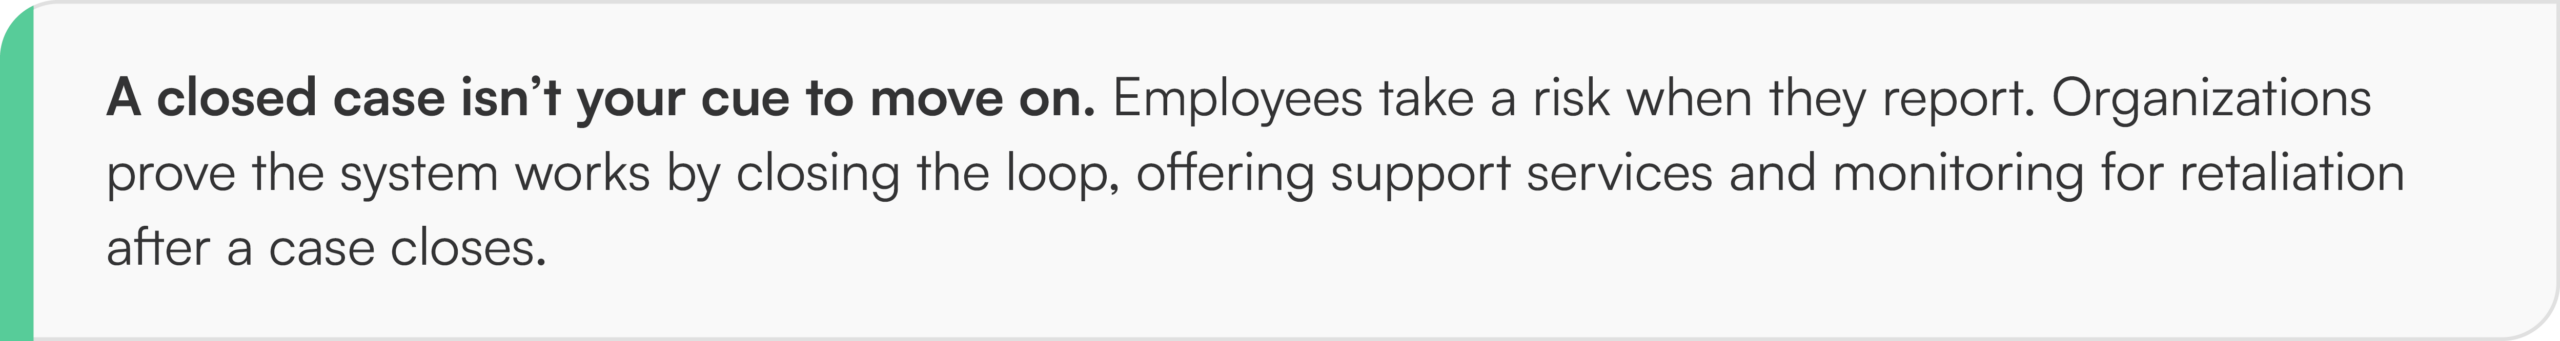
Handled well from intake through resolution, an organization’s response restores trust and shapes the broader employee experience, including whether people stay, refer others and speak up again.

A horizontal connected dot chart titled "Likelihood to Recommend Employer" with five data points linked by a dashed line, showing an overall upward trend. Starting from the left: all employees sit at 41%, which dips to 36% for those who experienced or witnessed misconduct, then rises progressively — 42% for those who reported an issue, 49% when the issue was investigated, and 55% when the issue was resolved. All data points are represented by teal/green dots with percentages labeled above in navy blue. The chart illustrates that while misconduct itself decreases employer recommendation likelihood, a thorough resolution process can restore and even exceed baseline employee sentiment.
A closed case isn’t your cue to move on. Employees take a risk when they report. Organizations prove the system works by closing the loop, offering support services and monitoring for retaliation after a case closes.

Survey Methodology & Respondents

A three-panel infographic under the heading "Survey Methodology & Respondents." Each panel is a navy blue rounded rectangle with a teal accent bar at the top. The left panel displays "Respondents" with the figure 2,043 and the label "U.S. Employees." The center panel displays "Data Collection" with the date "Jan. 2026." The right panel displays "Confidence Level" with the value "+/- 2.1 percentage points." The design presents the core methodology statistics in a clean, scannable format.

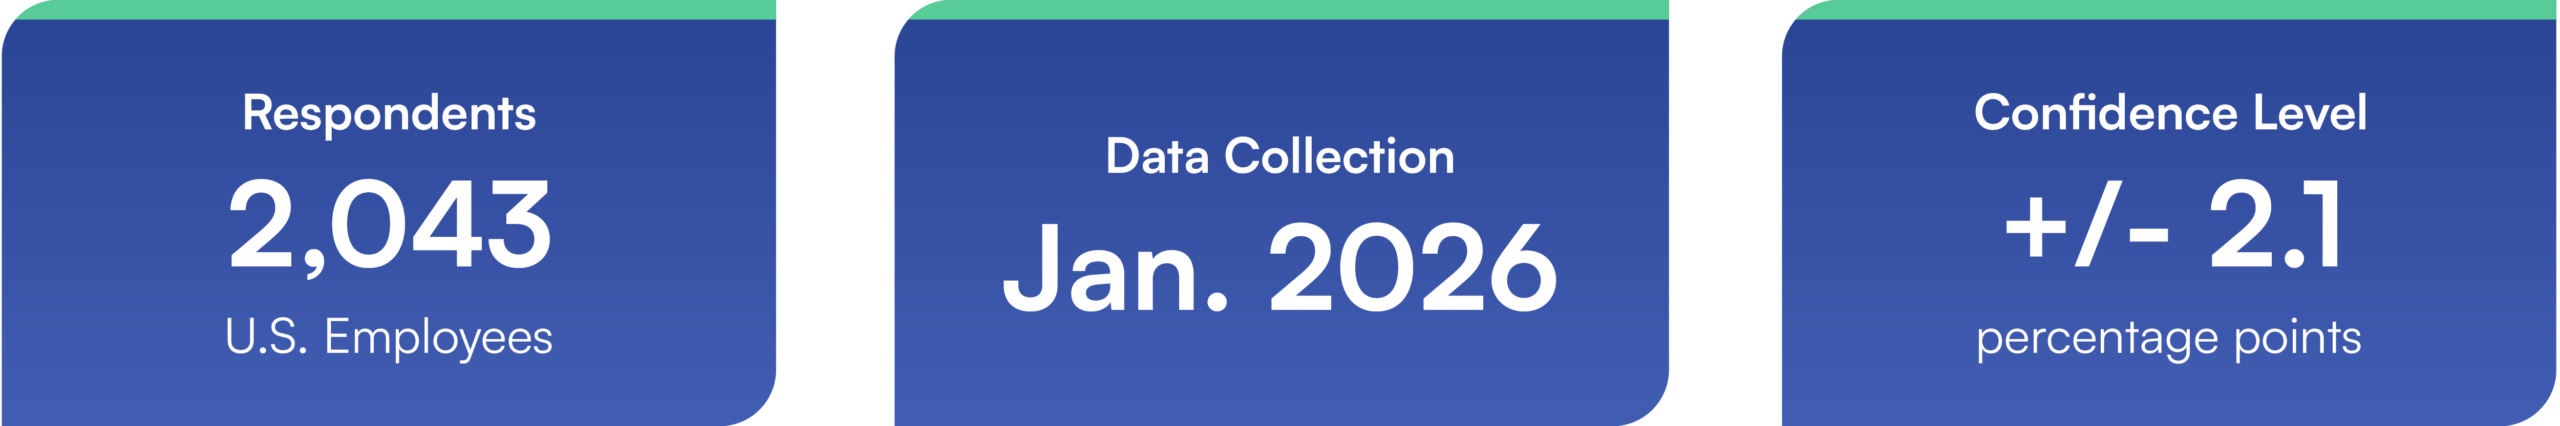
This research was conducted in partnership with Isurus Market Research and Consulting, an independent research firm. HR Acuity published similar employee studies in 2019, 2023 and 2024. HR Acuity also publishes an annual Employee Relations Benchmark Study providing insights into employee relations trends and practices.

© May 2026. All rights reserved. Data and images may only be reproduced with attribution to HR Acuity.

2025 Workplace Harassment and Misconduct Statistics
Read the Report