Ninth Annual Employee Relations Benchmark Study
The Ninth Annual Employee Relations Benchmark Study is here, packed with insights from leading organizations. Uncover trends in tracking metrics, investigations and strategies to foster trust and transparency. Empower your decisions with data that drives healthier workplaces.
A Message from the CEO
 Employee relations is at a critical turning point. The work we do has never mattered more. As workplace issues become increasingly complex and regulatory expectations shift rapidly, we simply can’t afford to manage issues based on instincts and guesswork. The only path forward is with insight, consistency and data. As I reviewed this year’s report, I felt urgency. Why are so many organizations still flying blind without standardized KPIs or a clear view of what’s working and what’s not?
This year’s Benchmark Study is more than a summary of trends. It’s a challenge: To mature the function, to get serious about measurement and to speak a common language that earns business credibility. We cannot mature what we do not measure. And we cannot gain a seat at the strategy table without proof of our impact.
That’s why this Study doubles down on one message: It’s time to start tracking what matters. Whether you’re just beginning your employee relations journey or refining a mature process, use this Benchmark to calibrate your performance across three dimensions: Operational Efficiency, Trust & Employee Experience, and Risk & Compliance. You don’t need to do everything overnight. Start small—case volume, time to close and issue type trends. It’s better to measure a few KPIs accurately than many inconsistently—because poor data is just as dangerous as no data at all.
At the same time, the pressure to adopt AI is rising. Your business leaders want speed, but in employee relations, we can’t sacrifice integrity for automation. Our work is about people—trust, accountability, fairness. Responsible AI can and will enhance how we work, but we must still be accountable for keeping humans at the center of every process. I encourage you to move forward with caution and care, but stay open to explore creatively, test responsibly and learn quickly— because the future is coming fast, and we can’t afford to be left behind.
As you read this report, ask yourself: What are we tracking? How are we learning? Where do we go from here? Let this Benchmark Study be your invitation to lead—and your roadmap.
If we want to build trust and stay ahead of risk, we can’t afford to wait.
Deb Muller, CEO and Founder of HR Acuity
Key Takeaways from the Ninth Benchmark Study
 Gaps in Tracking Key Employee Relations KPIs Hinder Strategic Decision-Making
- Many organizations (68%) fail to track the number of issues per case, creating a blind spot in understanding case complexity and the effectiveness of employee relations and investigations processes. On average, cases involved 1.4 distinct issues, which suggests that organizations may be underestimating the actual complexity. Complex cases often require more time, resources and expertise. To truly understand complexity, as well as to facilitate planning and appropriate allocation of resources, case management systems must be configurable to capture multiple issues per case.
- Only half of organizations track substantiation rates and just 30% track substantiation rates by issue type, which are essential to identify trends and patterns, assess the consistency and fairness of investigations and shed light on systemic cultural issues that may impact outcomes. Organizations can use case disposition insights to implement targeted interventions to prevent recurring problems, direct resources where they are most needed and foster trust and accountability to create a healthier workplace culture.
- Nearly half lack substantiation data for the most serious issues—including retaliation, harassment and discrimination, leaving their organizations exposed to risk. Given that harassment and discrimination cases are at an all-time high and retaliation claims are the most common issue type brought to the EEOC, monitoring case disposition by issue type is essential to mitigate risk, analyze compliance trends and identify areas for improving processes and outcomes.
We have taken higher-risk situations and turned them into early settlement, saving us more than 20% in litigation and settlement costs.
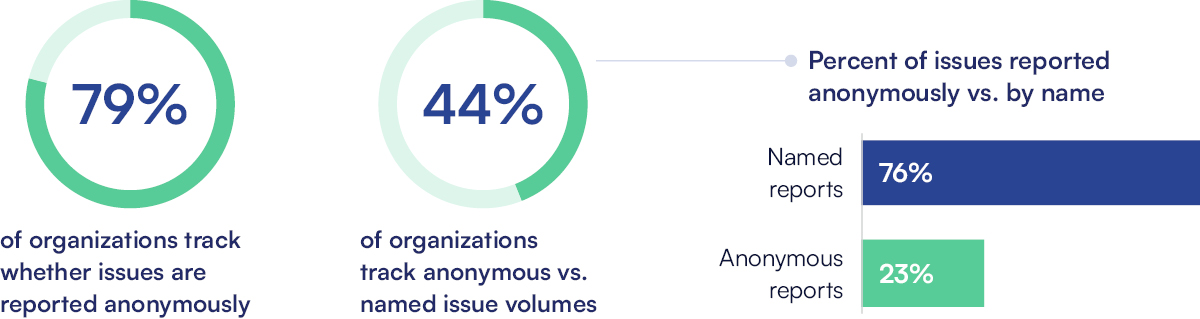
- Most organizations (79%) track whether issues are reported anonymously or by name, but only one-third track the volume of each type of report. The gap limits understanding of the effectiveness of reporting channels, employees’ trust in the process and trends related to anonymity. Tracking and analyzing these metrics is essential to building trust and creating a culture of accountability.
 Surging Misconduct and Retaliation Allegations Highlight the Need for Structured Investigations
- In 2024, the volume for discrimination, harassment and retaliation claims reached 14.7 issues per 1,000 employees. This volume is predicted to rise further in 2025 and beyond due to ongoing regulatory changes. It signals the importance of identifying trends or spikes in specific issue categories and comparing data across teams and locations to address and prevent future issues and improve outcomes.
- Nearly all organizations (88%) agree that investigators follow the required or suggested practices for conducting investigations. Yet, use of required investigation processes remained steady by 57% of organizations, leaving more than 2 in 5 exposed to risk with lax processes that put consistency, thoroughness and fairness at stake.
- Organizations that use structured investigation processes are more likely to track substantiation rates, integrate employee relations data with other employee data and use data to identify areas for process improvements and targeted initiatives. Embedding consistency and accountability into the investigation process reveals the downstream effects and broader impacts of process compliance. This approach helps establish a strategic function and strengthens workplace culture, ultimately benefitting the organization.
- On average, investigations conducted with a required process took 2-7 days longer to close than those conducted using a suggested process. This may be because a required process ensures a complete, airtight, defensible investigation, whereas a suggested process is more vulnerable to cutting corners, despite an investigator’s best intentions.
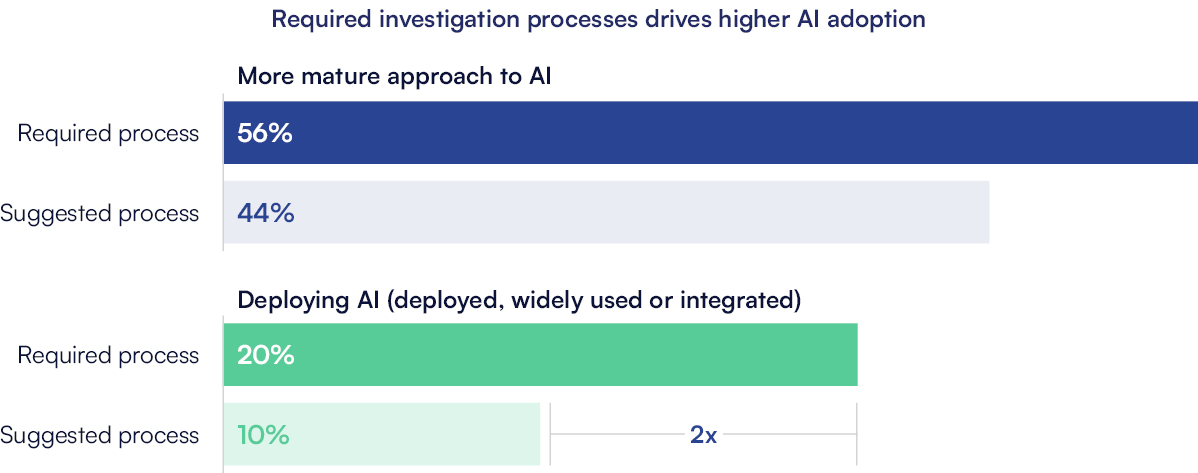
 Artificial Intelligence (AI) Adoption in Employee Relations is Still in the Early Stages
- Nearly half (44%) of organizations characterized their adoption of AI as non-existent, while one-third of organizations are proceeding with caution. They are exploring capabilities, evaluating appropriate uses and piloting select projects to enhance ER processes.
- Organizations that use structured investigations processes are more mature in their use of AI and two times more likely to incorporate AI for use in ER and investigations.
AI tools must go through an AI governance committee for approval before we pilot use cases or incorporate AI into our business practices.
Established Norms & Essential KPIs for Employee Relations
Measuring What Matters in Employee Relations
Employee relations has evolved beyond issue resolution—it’s becoming a strategic driver of efficiency, trust and safer workplaces. To unlock its full potential, organizations must adopt and track standardized, business-aligned KPIs across three critical categories: Operational Efficiency, Trust & Employee Experience, and Risk & Compliance. These metrics provide a universal language to measure performance, uncover trends and identify gaps, offering real-time insights that connect employee behavior, performance management and organizational outcomes. By leveraging actionable data, ER teams can move from reactive to proactive, addressing cultural concerns, mitigating risk and demonstrating the strategic value of employee relations to build trust and transparency.
These KPIs serve as the foundation for understanding how well organizations are fostering trust, minimizing risk and delivering ROI. Without these performance metrics, employee relations remains reactive and misses the opportunity to mitigate risks, address cultural concerns and demonstrate strategic value to the business.
Use this Benchmark Study as your guide to know what’s imperative to track, where your organization stands and how to begin capturing and using data effectively. Whether your organization relies on ER case management technology or simple spreadsheets, the goal is the same: To create a data-driven approach that not only addresses today’s challenges but also positions your organization to thrive in the future.
Established Employee Relations Norms
The Employee Relations Benchmark Study monitors both emerging and established norms, offering valuable insights into enduring employee relations practices. Introduced in 2023, these standardized norms are rooted in consistent data patterns and trends observed over the past nine years, reflecting the growing maturity of the employee relations function. Organizations can rely on these norms as a trusted foundation to guide the development and refinement of their ER strategies.
In the downloadable report, a gold star icon indicates to readers when a norm is linked to a specific section, data point or KPI. As the employee relations landscape evolves, the study will continue to revisit and update these practices to ensure relevance and impact.
Centralized/Mixed Organizational Model
- Used by 94% of organizations
- Centralized ER or shared services group with additional field resources
Resource Allocation
- Employee Relations Professionals – 0.6
- HRBPs/Generalists – 2.5
- In-House Lawyers – 0.2
7 Core ER Case Types
- Policy violations
- Behavioral issues
- Harassment (sexual and non-sexual)
- Retaliation
- Discrimination
- Performance
- Time and attendance
Additional Responsibilities
- Employee relations analytics
- Proactive employee relations training
- Policy oversight/governance
- Policy development or benchmarking
4 Core Metrics Tracked
- Issue type
- Issue by location
- Issues by department/function
- Issue disposition
The 10 Essential KPIs for Employee Relations
New in 2024, HR Acuity established a recommended list of employee relations KPIs for organizations to track and monitor regularly. Tailoring these KPIs to your organization’s requirements and data maturity enables benchmarking of employee relations performance across functions, regions, investigators and issue categories. These KPIs ensure accountability, repeatability and visibility into employee relations processes and help shape the future of the function. For more information, refer to the 10 Employee Relations KPIs overview.
Case Volume per 1,000 Employees by Category
- Normalizes case activity for identifying trends, hotspots and benchmarking
EEOC Cases per 1,000 Employees
- External trust barometer that reveals
trust gaps, process breakdowns and financial risk exposure
Issue-to-Case Ratio
- Tracks case complexity to expose emerging trends in employee
concerns and investigator workloads
Case Disposition (Substantiation Rate)
- The percentage of issues having merit (substantiated) to assess reporting
quality and investigative outcomes
- Highlights necessary process improvements to address employee concerns more effectively
Employee Relations Staffing Ratio
- Measures resource allocations based
on company size to align employee relations capacity with organizational growth
Hotline Issues per 1,000 Employees
- Monitors volume of issues reported through a hotline
- Assesses effectiveness of channels
for raising concerns
Named vs. Anonymous Reports
- Offers insights into employee trust and psychological safety in the workplace
eNPS (Employee Net Promoter Score)
- Gauges employees’ future willingness to report issues based on past experiences, reflecting trust and issue resolution effectiveness
- Used to identify unresolved concerns, refine investigation processes and inform strategies to support, re-engage and retain talent
Performance Management Impact
- Calculates performance-related severance costs per employee
- Evaluates the impact and efficiency of performance management strategies
Legal Cost per Employee
- Tracks the per employee cost of the total external legal and settlement costs related to employment issues
- Demonstrates the financial impact of effective ER practices
Issue Trends
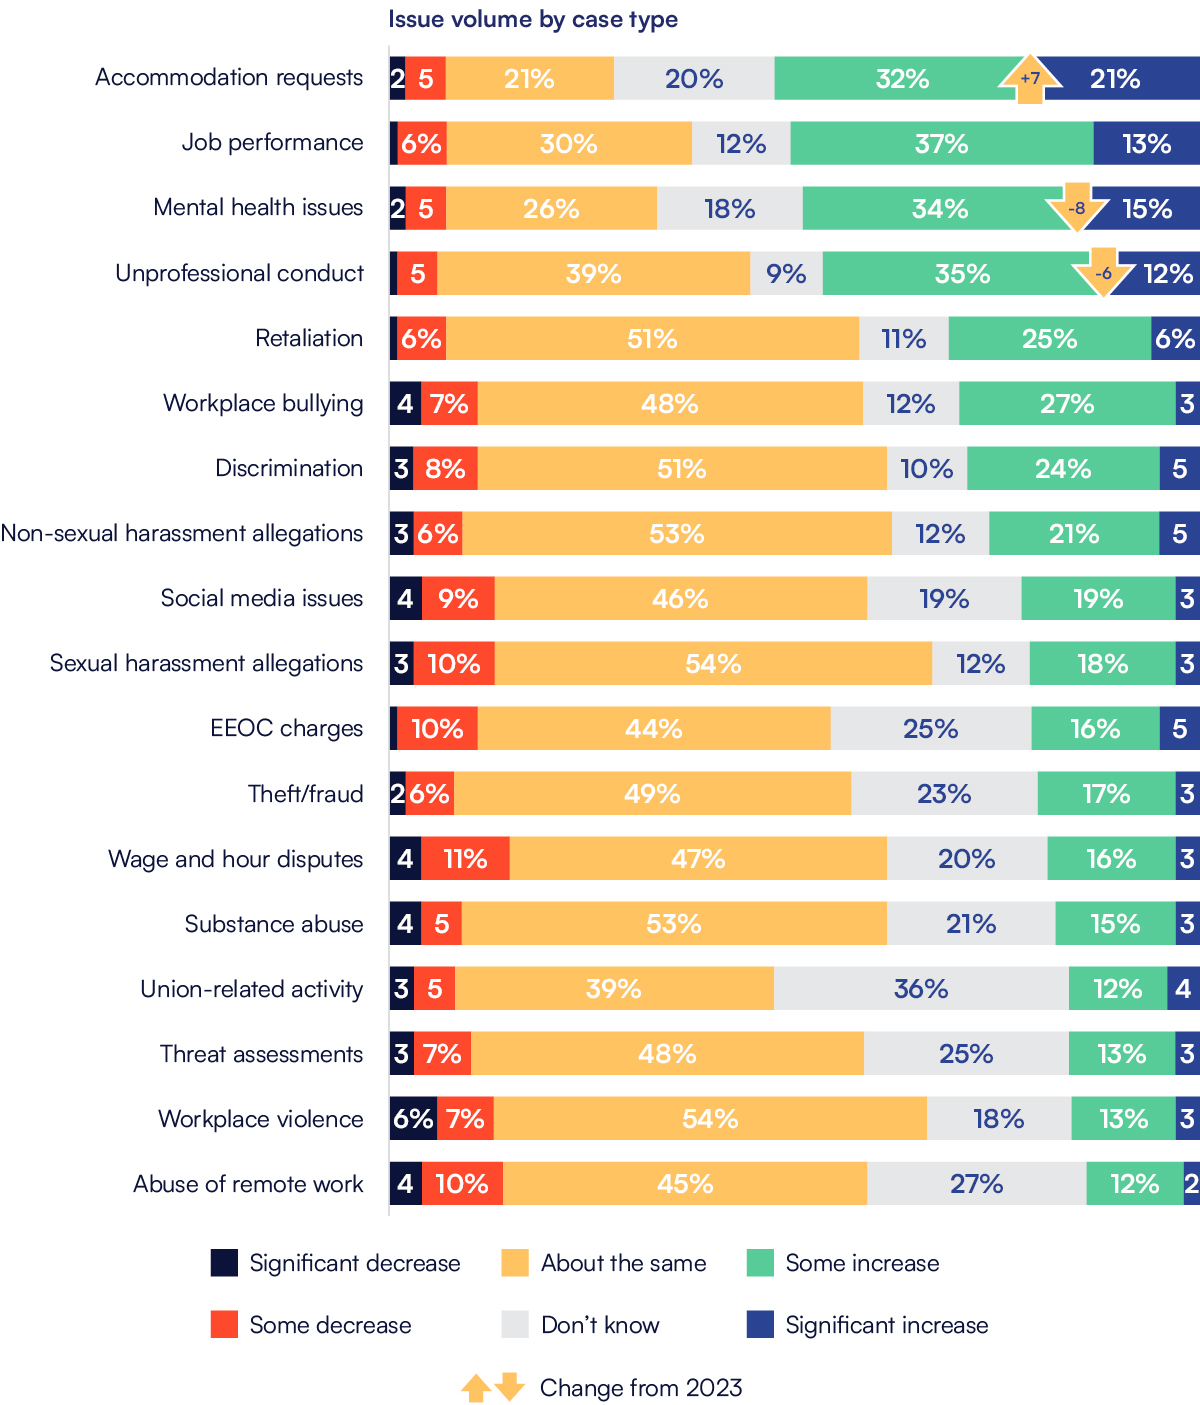
Accommodation Requests Saw the Greatest Growth in Reported Issues by Case Type
Far fewer organizations reported increased issue volumes across many categories. Accommodation requests topped the list with the most significant growth. The volume of mental health issues continued to rise maintaining the uptrend started in 2022, though at a slower rate. Notable data gaps continue to exist for eight issue types, with at least one in five organizations reporting they “don’t know” how issue volume is trending. Lack of insight into issue volume trends causes employee relations to be reactive rather than proactive and prevents a comprehensive understanding of overall workplace health.
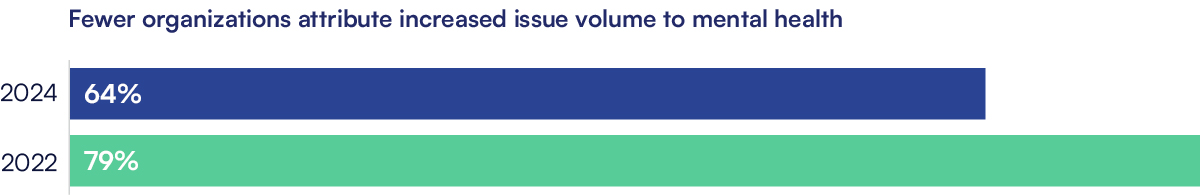
Mental Health Challenges Were Cited as the Leading Driver of Employee Issues
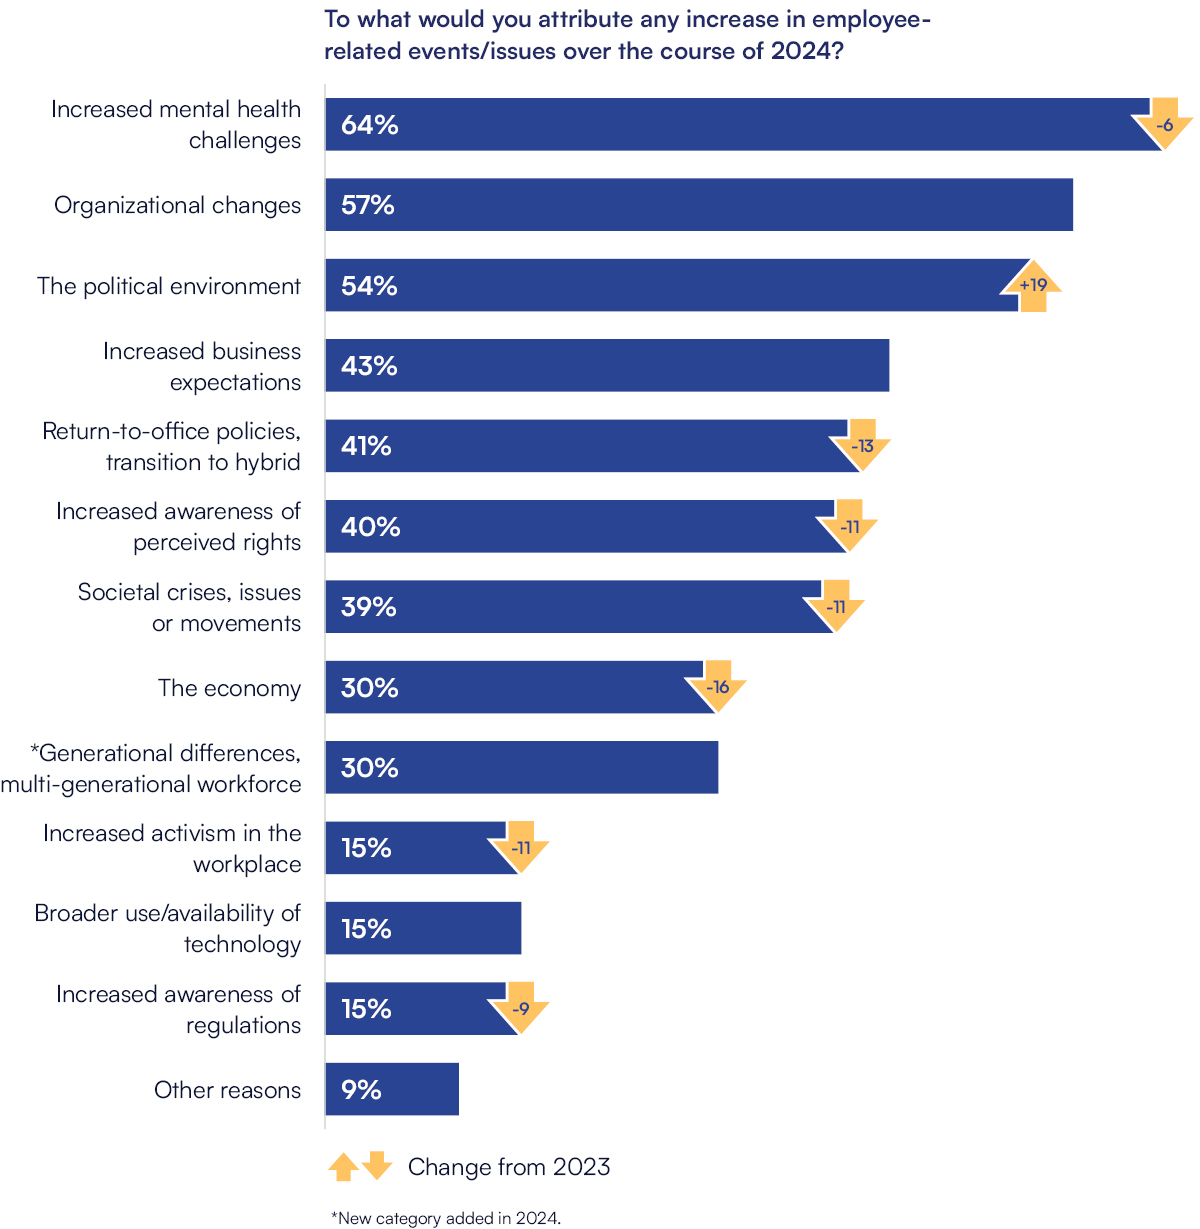
The Greatest Growth in Issue Volume Attributed to Political Climate
Aligned with the overall drop in case volumes, organizations noted decreases in several factors driving issue volume. Mental health remained the top driver for the third year in a row but continues to decline.
Unsurprisingly, the political environment caused a surge in issue volumes in the 2024 election year. One-third of organizations also cited increased volume in generational workforce issues, a new category in 2024.
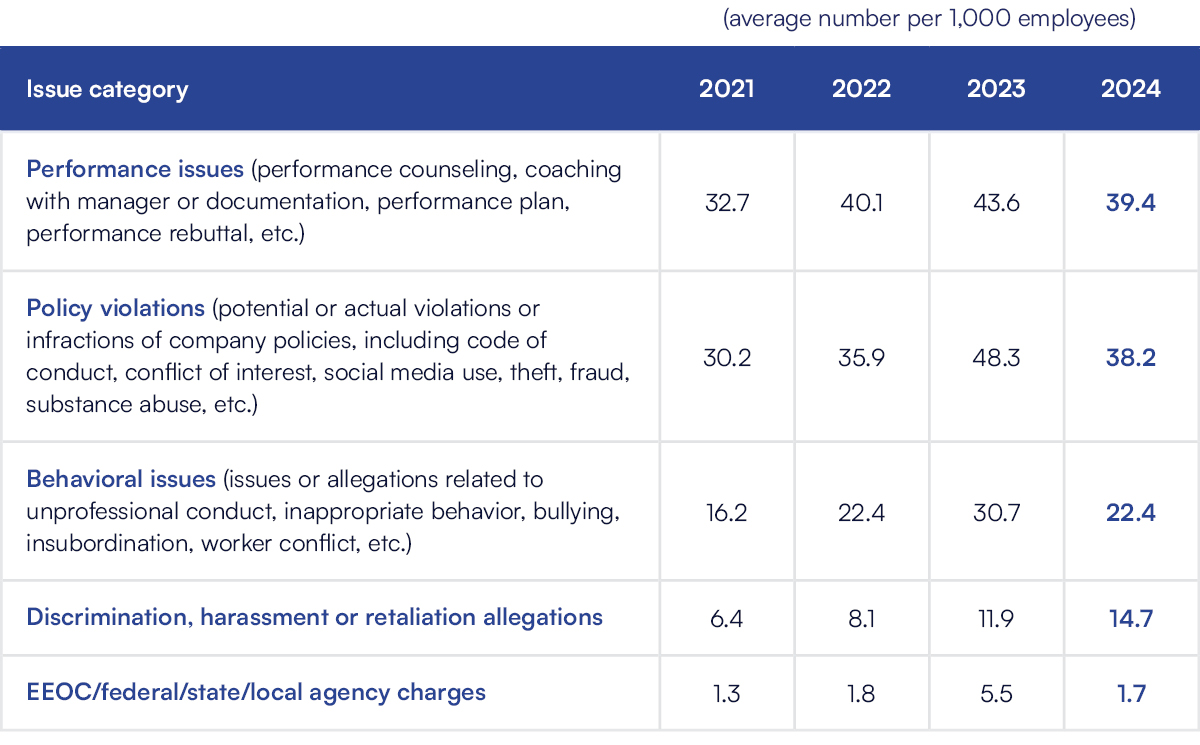
Overall Case Volumes Are Down, but Discrimination, Harassment and Retaliation Allegations Reached an All-Time High
Case volumes decreased in 2024 across four of the five major issue categories. However, discrimination, harassment or retaliation case volumes, which soared in 2023, continued to climb in 2024, reaching an all-time high in Benchmark history.
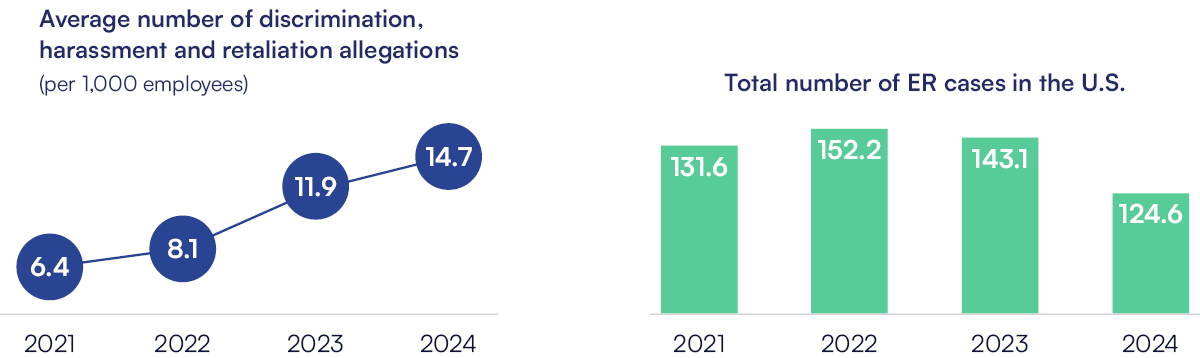
After a spike last year, policy violations returned to a more typical level in 2024. Total case volume also dropped again in 2024, likely due to the growing complexity of cases, where a single case may consist of multiple issues, such as a performance case that also includes a behavioral issue.
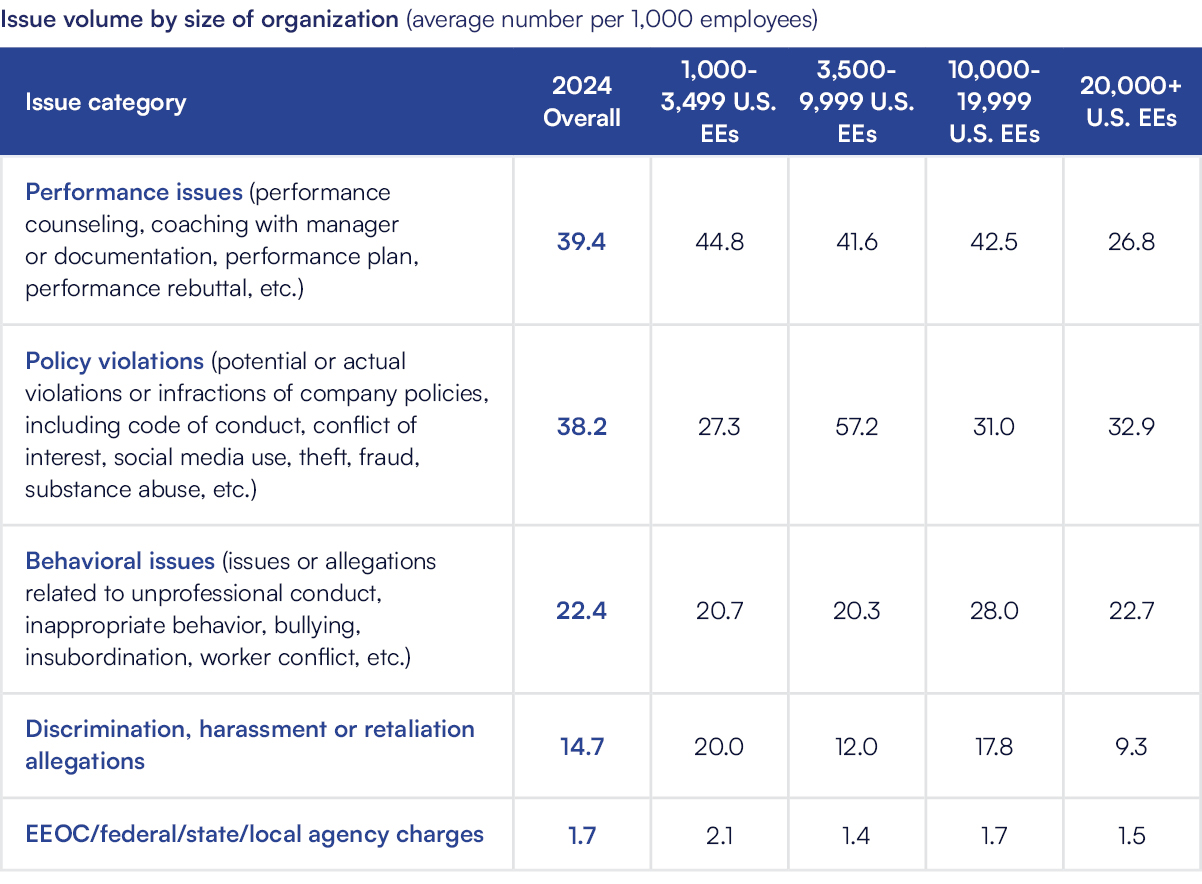
Mid-Size Organizations Saw the Greatest Volume of Employee Issues, Highlighting Challenges
A look at case volumes by category and by company size reveals some significant differences. The largest organizations reported the lowest volumes, likely benefiting from investments and economies of scale. Small organizations generally also experienced lower than average volumes.
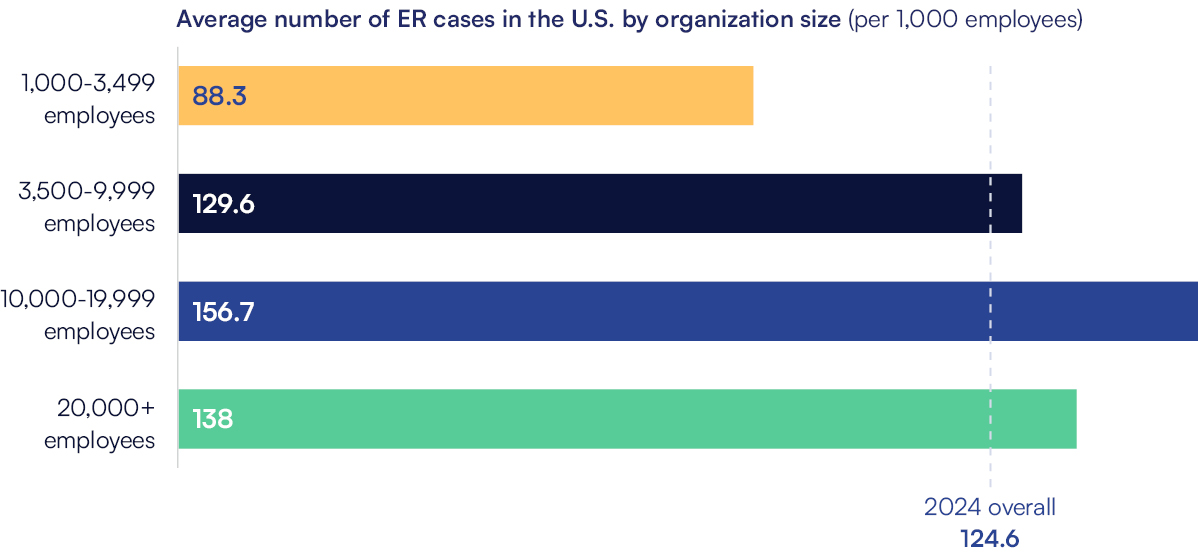
However, midsized organizations faced the greatest challenges: Organizations with 3,500-9,999 employees saw the greatest volume of issues per 1,000 employees with particularly high volumes of performance issues and policy violations, while those with 10,000-19,999 employees grappled with elevated numbers of performance, behavioral issues and misconduct.
Limited Insight into Issue Volume Hinders Proactive Employee Relations
To provide more comprehensive data on issue volume metrics in 2024, the Benchmark Study collected data on 12 issue categories in 2024. Surprisingly, the majority of organizations did not track issues per case. Without this data, organizations cannot adequately plan for the resources, time and thoroughness needed to appropriately handle employee issues and conduct effective investigations.
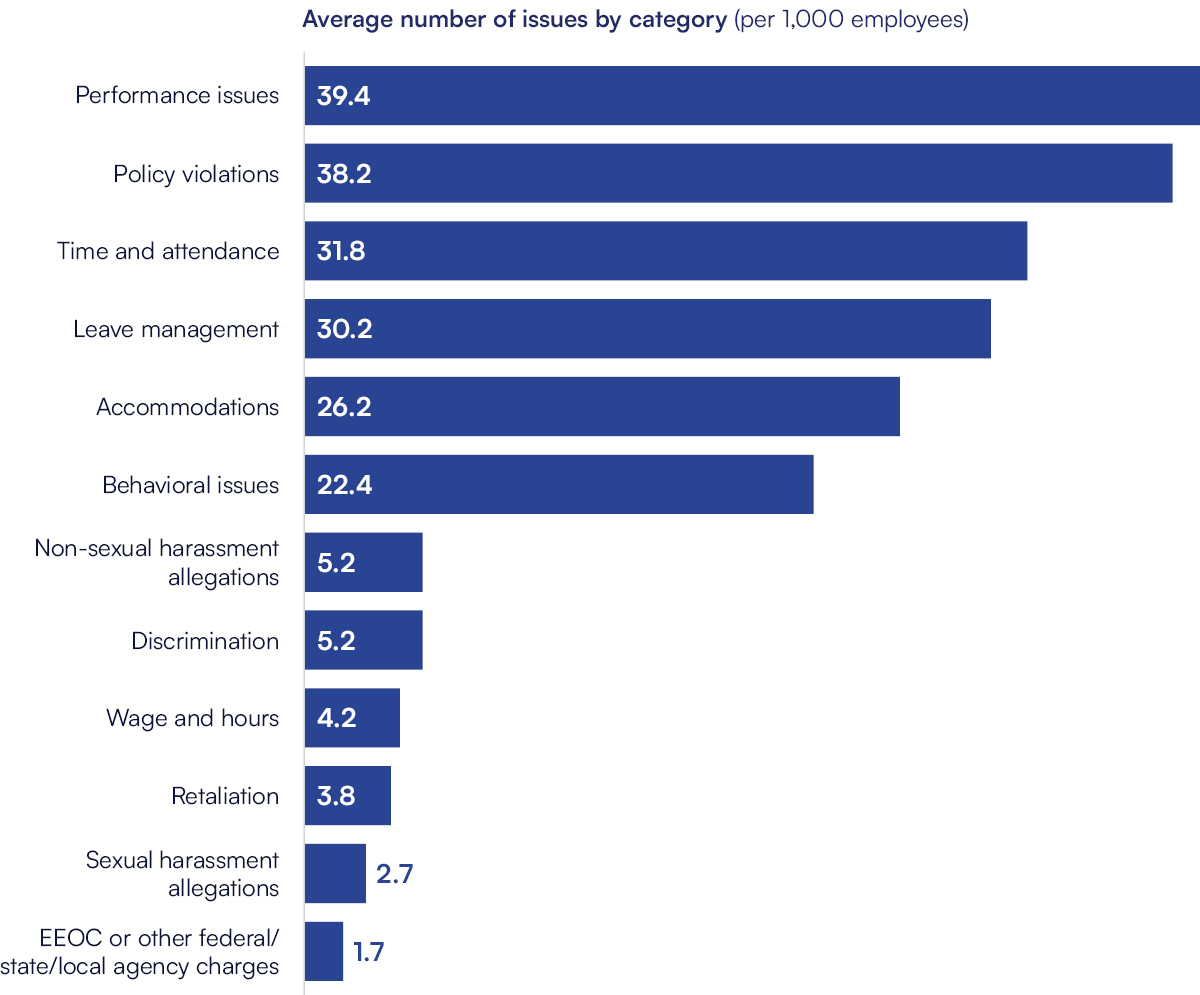
New Insights Highlight Hidden Layers in Case Data, Signaling Case Complexity
For the first time in 2024, the Benchmark Study provides insights on case volume relative to issue volume, as well as on case complexity. The data reveals that while the overall issue-to-case ratio is 1.4 issues per case, the majority of cases in organizations that track this metric involve only a single issue.
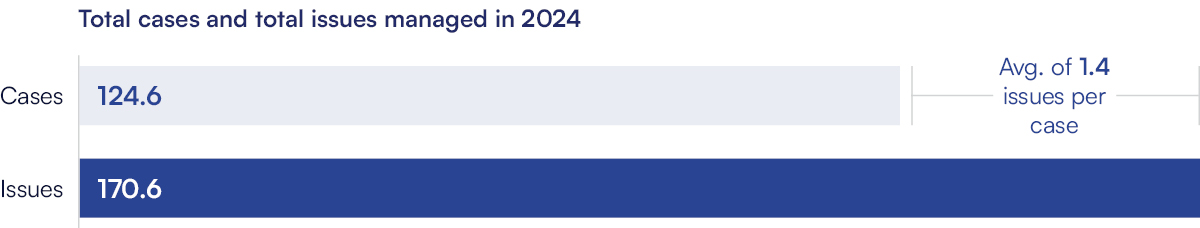
As more than two-thirds of respondents indicated they do not track the number of issues per case, this data is directional in nature and likely underestimates case complexity. As case complexity is one of the most important KPIs for employee relations to analyze, the Benchmark Study will continue to monitor issue volumes by category and the issue-to-case ratio to see how they trend in the future.
Issue Reporting
Gaps in Issue Reporting Data Are a Missed Opportunity to Assess Workplace Culture
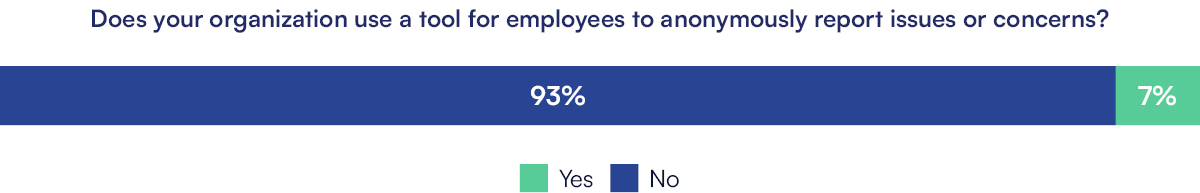
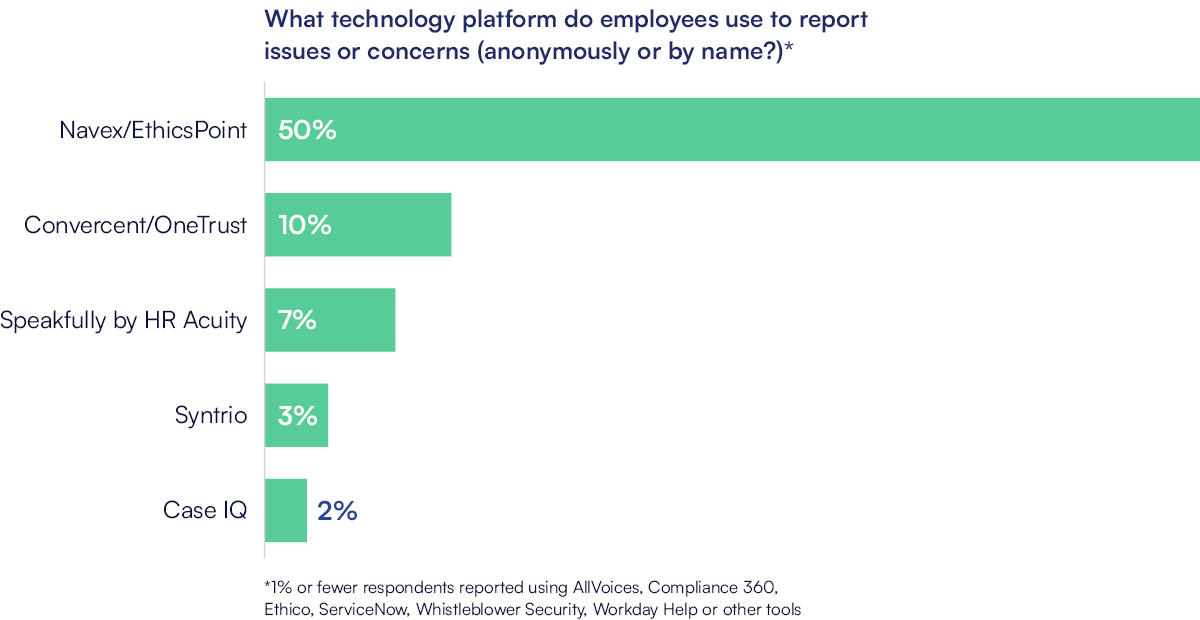
Nearly all organizations offer tools for anonymous reporting and track whether issues are reported this way.
Yet, over half lack data on the volume of anonymous versus named reports. For those who tracked this metric, three of every four issues were reported by name.
Technology Platforms Used to Report Employee Issues or Concerns
Organizational Resources
Employee Relations Resource Norms Hold Steady Despite Rising Performance Issues and Team Structure
The standardized norms for employee relations, established in 2023 based on more than six years of consistent data, include staffing resources and core responsibilities that routinely comprise the scope of employee relations. To determine benchmarks based on organizational size, the data is normalized and reported as norm for resource allocation. As performance issues reached an all-time high in 2023, the Study revisited this category to assess a change in scope.
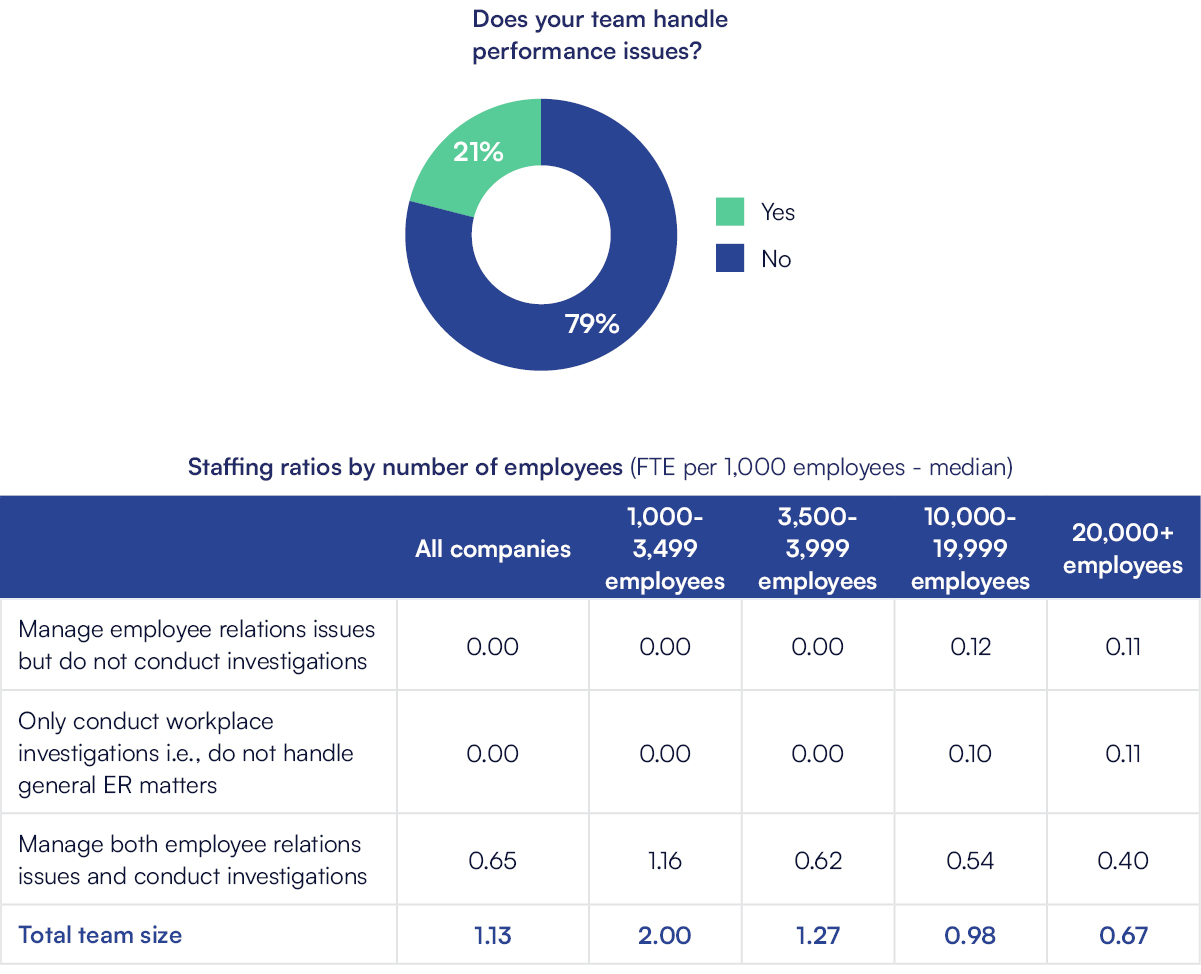
The findings showed no change to the scope norm. To better understand the impact of resources assigned to manage employee relations and investigations, this year’s participants were asked to provide data on team size. The findings mirrored the resource allocation norm, illustrating economies of scale. Larger organizations rely on fewer resources than smaller organizations to manage the function and are more likely to separate out employee relations roles.
Managing Cases
How Employee Relations Cases Are Assigned
While case assignment by line of business (LOB) has been the leading approach since 2018, it is only used by about one-third of organizations. This method enables employee relations professionals to apply their expertise in the business’s unique culture, processes and needs, driving efficiency and tailored solutions. However, it’s not without challenges. Line of business-based assignments can create workload imbalances across the employee relations team and may raise concerns about neutrality.
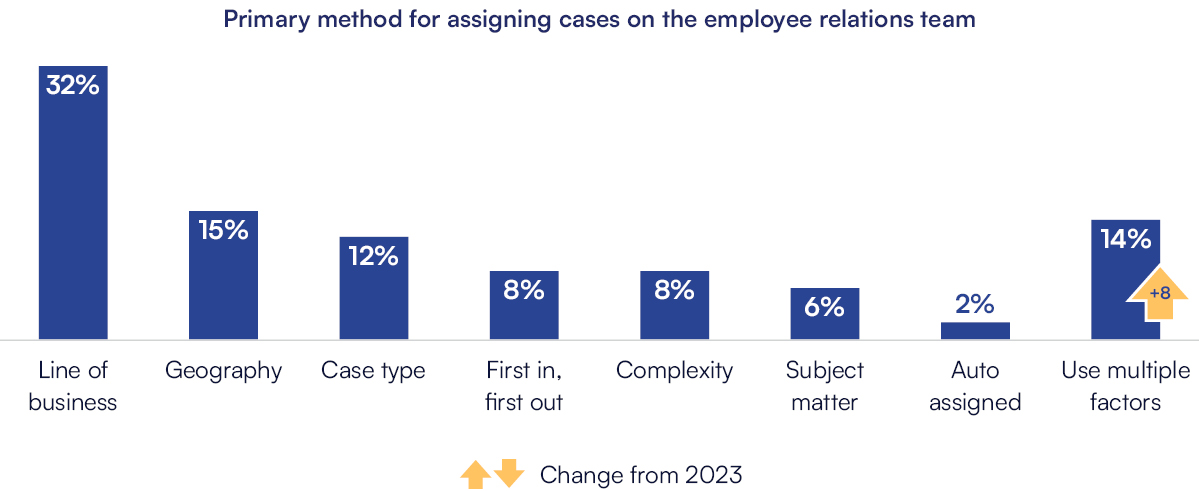
Interestingly, other case assignment methods have shifted in rankings over the years. This year’s findings showed an upward shift in the number of organizations using a combination of factors, rather than relying on a single primary method to assign cases. Organizations using a centralized model were more likely to assign cases by line of business (LOB) than those using a mixed model. These trends highlight the evolving strategies organizations are adopting to balance expertise, fairness and operational efficiency.
Average Time to Close by Employee Relations Case Type
Based on feedback from participants, we revised the approach to measure time to close in number of days rather than weeks, to provide more precise and granular data by case type.
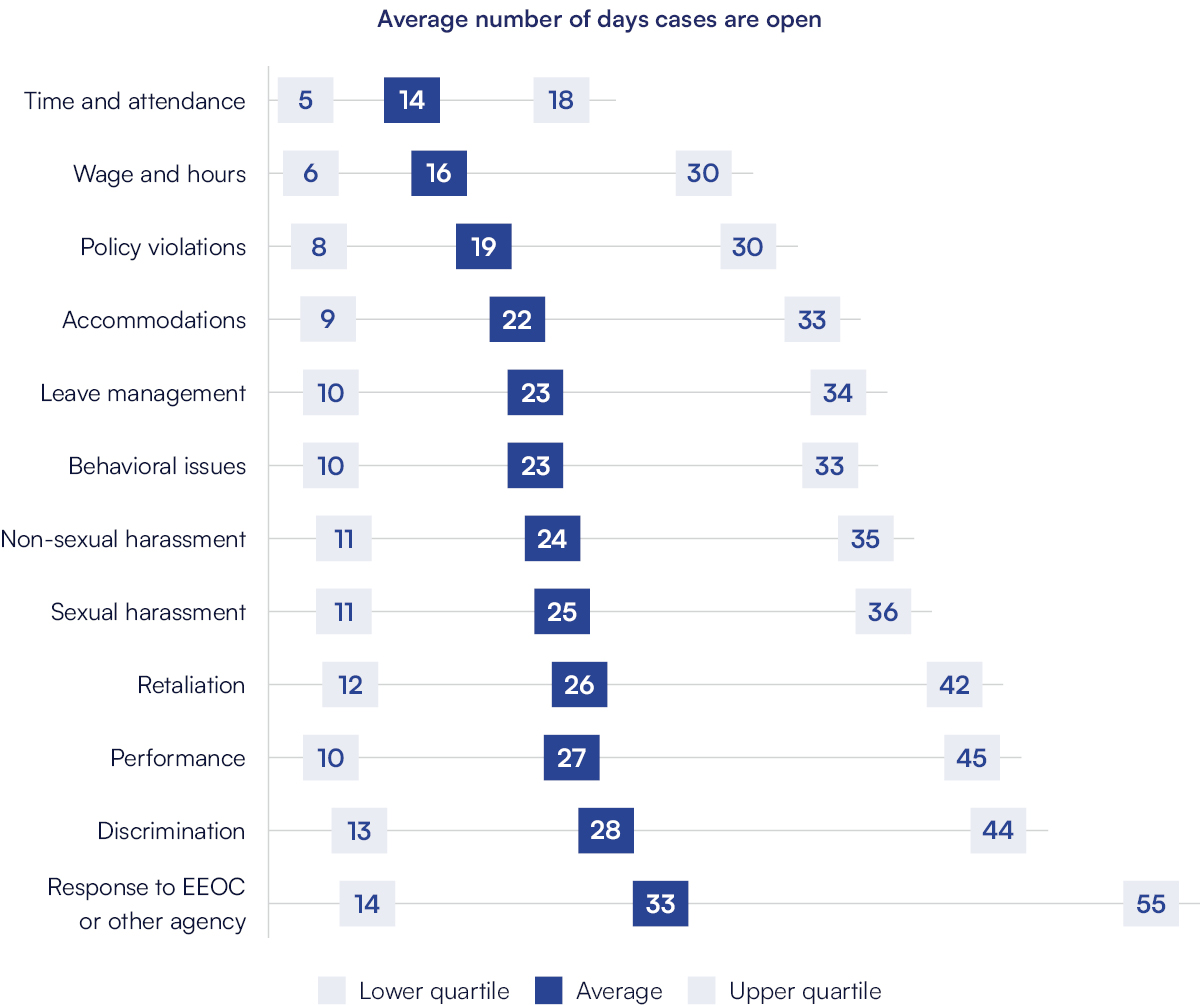
Understanding both the average time to close and the typical range in time to close can help organizations see whether they fall within the typical range, even if they are above or below average. This benchmark equips teams to allocate resources effectively and identify process improvements to drive efficient case management and support timely issue resolution.
Thorough Investigations Take Time, but Reduce Risk
For most case types, the time to close is longer when a standardized, required process is followed to conduct investigations. This is unsurprising, as required processes are more thorough than suggested processes and more likely to result in complete and consistent investigations.
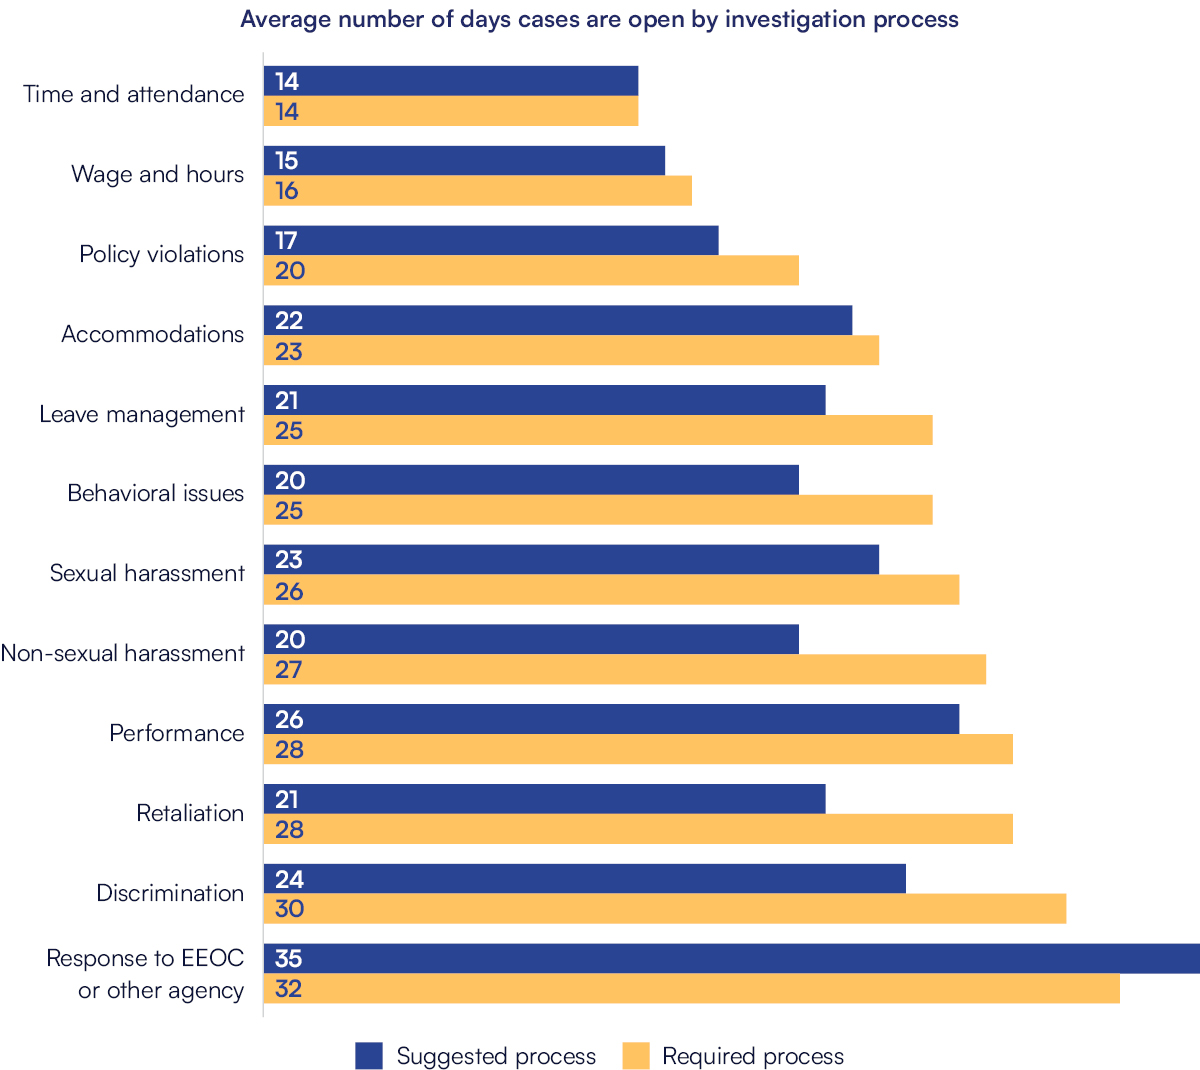
The only exception was for EEOC charges. For these claims, required investigation processes are more efficient, likely because they include all of the necessary steps to ensure that investigations for EEOC cases are thorough, consistent and fair. Suggested processes are often left to the discretion of investigators and may not be followed consistently, resulting in investigations that are less than airtight, fair or compliant, leaving organizations exposed to legal and brand risk.
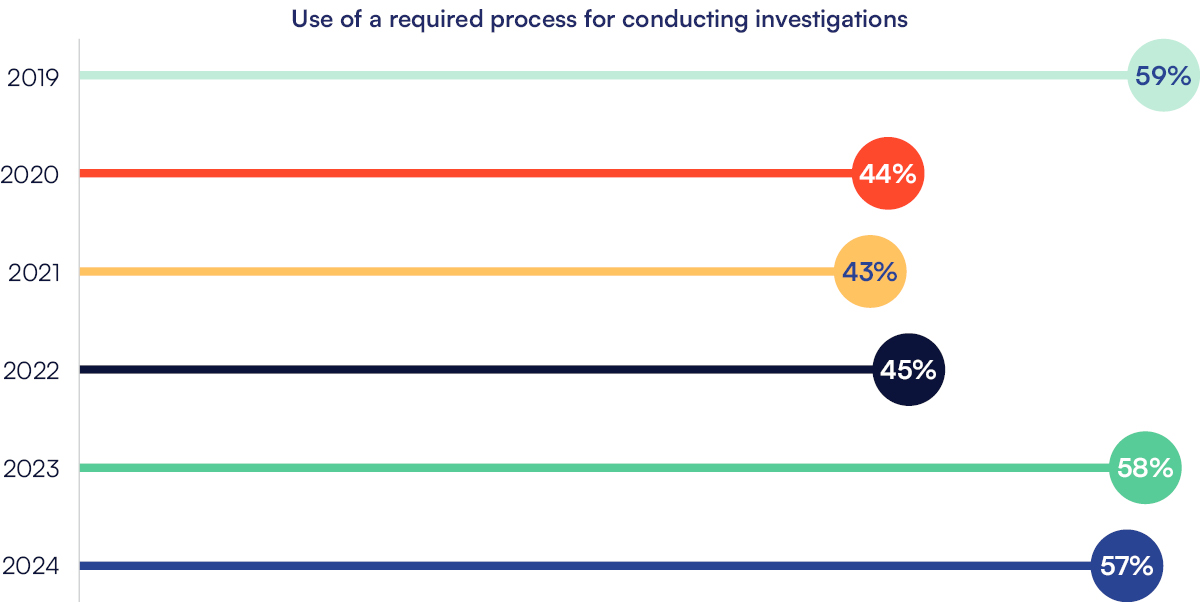
Required vs. Suggested Workplace Investigation Processes
In 2024, the use of required investigation processes remained steady, likely driven by the EEOC’s guidance and commitment to enforce timely responses, appropriate actions and dedicated efforts to prevent harassment. Adoption was highest among Fortune 100 and Global 500 companies where the potential for brand-damaging risk is high and ER functions are typically more mature.
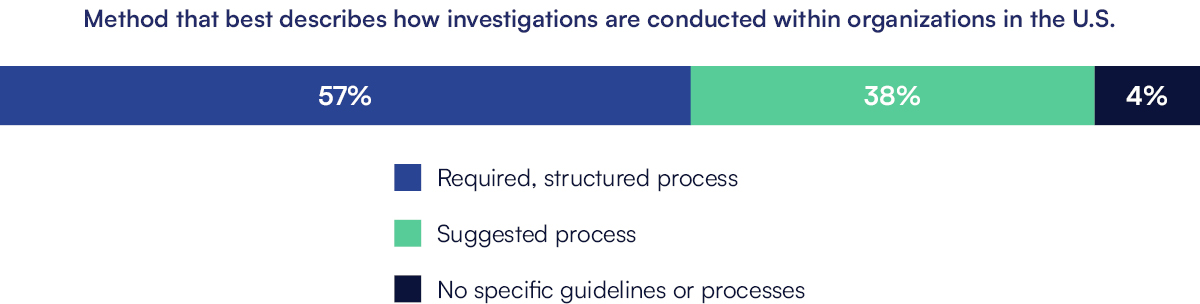
Organizations who have taken the ER/Q Maturity Model assessment were also more likely to use a required investigation process, indicating that they recognize the impact the process has on employee relations outcomes. However, many organizations still lack robust processes, which present challenges in ensuring thorough, consistent, compliant investigations and expose organizations to increased risk.
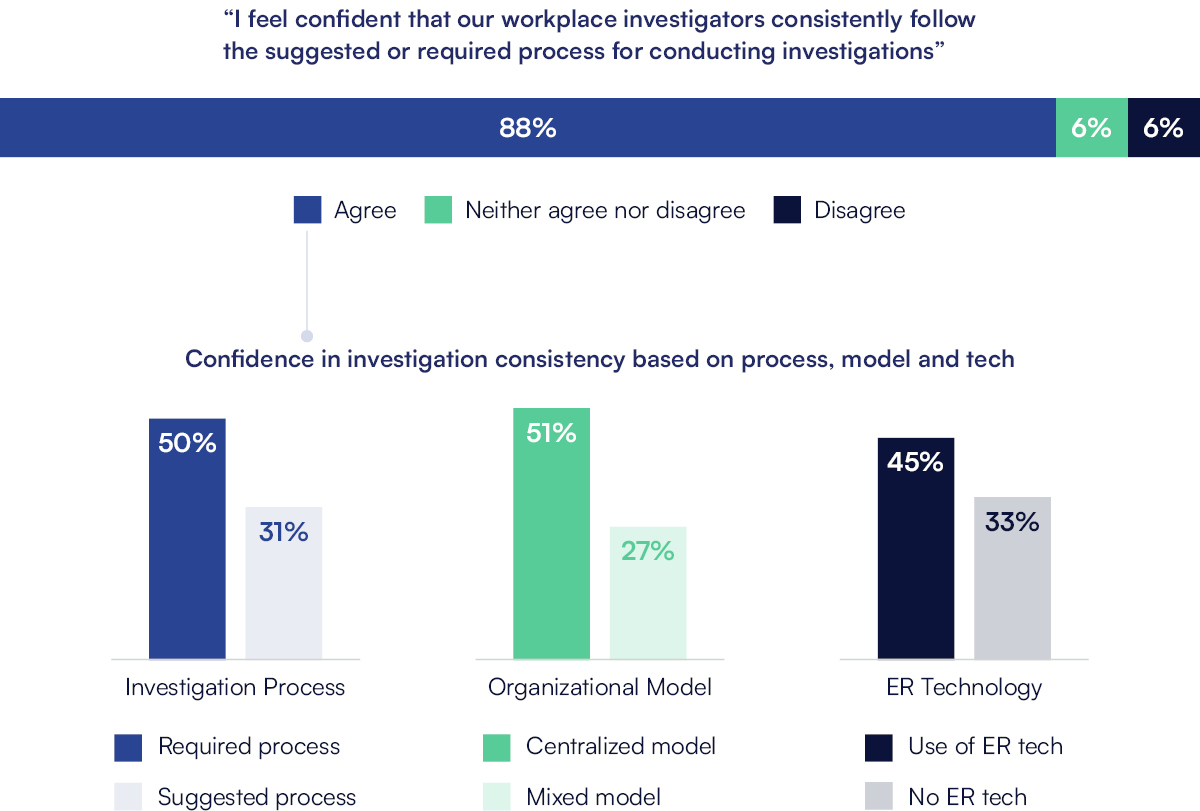
Confidence in Workplace Investigation Processes
Organizations have strong confidence that workplace investigation practices are followed. High confidence correlates with use of a required (not suggested) investigation process, a centralized ER model and employee relations technology to manage employee relations investigations.
Lack of Substantiation Data Impacts the Ability to Foster Employee Trust
The 2024 findings showed that just half of organizations track overall substantiation rates.
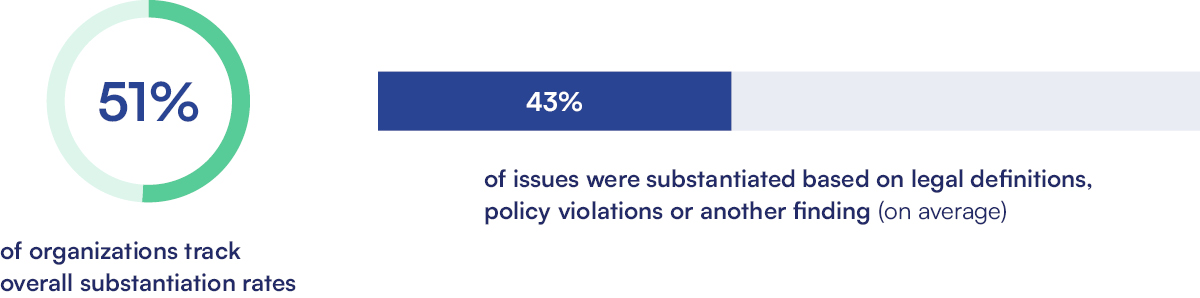
Tracking case disposition by issue type is even less common, as just one in three of these organizations tracks disposition by case type and still fewer have access to substantiation data for all issue categories. This critical gap limits visibility into outcomes and hotspots.
It also compromises the ability to see trends, identify needs and recommended actions to improve employee experience, build employee trust and confidence in the process and prevent future issues.
Organizations that use technology designed for the unique needs of ER are more likely to have access to substantiation data. Fortune 100 and Global 500 companies track case disposition at higher rates than most organizations, perhaps to stay ahead of potential brand risks.
Substantiation by Issue Type Requires Deeper Scrutiny to Mitigate Risk
This year’s results regarding case disposition rates for major issue types mirror the Eighth Benchmark Study data with a large portion of unsubstantiated issues across all categories. However, even if an issue was not substantiated, actions may have been taken following the investigation. For example, year over year organizations often recommend follow-up actions such as training to address concerns and prevent future issues.
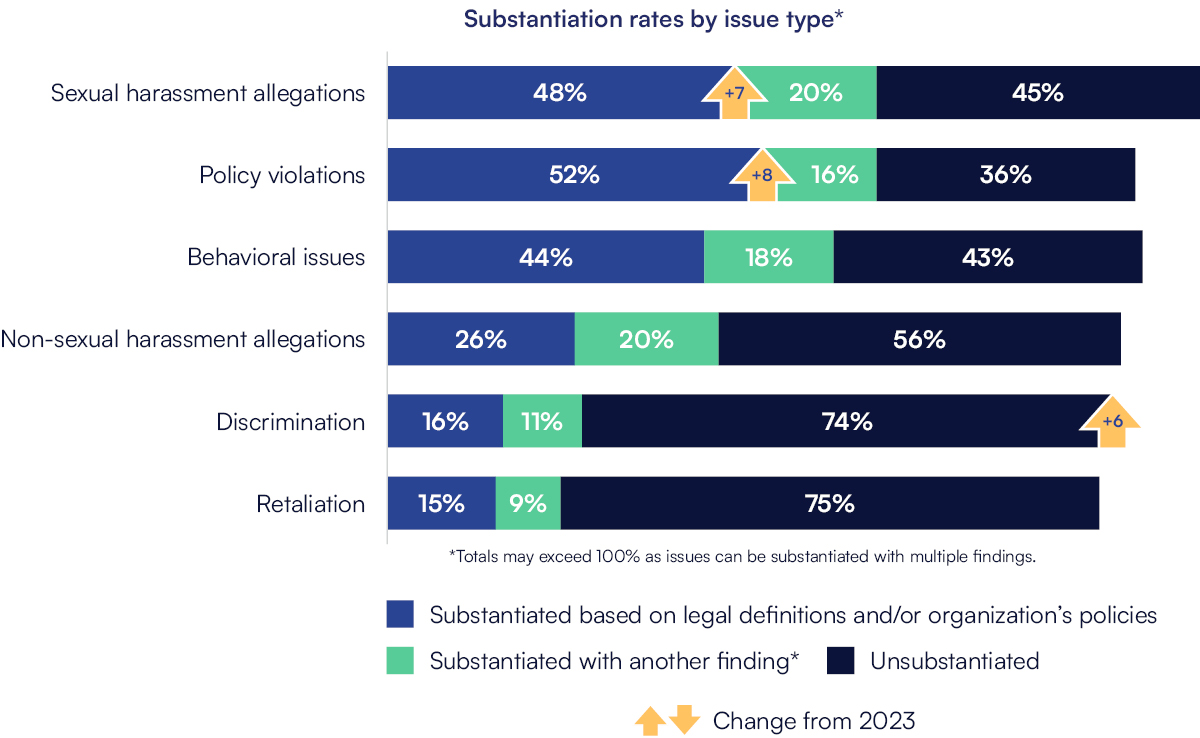
While the low rate of substantiated retaliation claims is also consistent with prior Studies, it is concerning. Retaliation claims often follow discrimination claims and are the most common claims brought before the EEOC. They are also more likely to be found unlawful, even if the original allegation had no merit. It is critical that retaliation claims are thoroughly explored even if introduced late in the process.
How Employee Relations Teams Track Employee Issues and Investigations
Purpose-built technology for managing employee issues and investigations continues to dominate as the primary tracking method for employee relations, reflecting its ability to address the unique complexities of employee relations.
A related and encouraging trend shows more organizations moving away from spreadsheets and generic databases in favor of purpose-built solutions. However, ticketing systems are still surprisingly common in many large organizations, including Fortune 100 and Global 500 companies.
This may be due to lingering misconceptions that single-platform standardization can adequately meet HR needs or to HR’s limited control of the employee relations tech stack. Effective employee relations requires an investment in solutions specifically designed to proactively manage employee issues and investigations to drive strategic business decisions, mitigate risk and better protect both the organization and its employees.
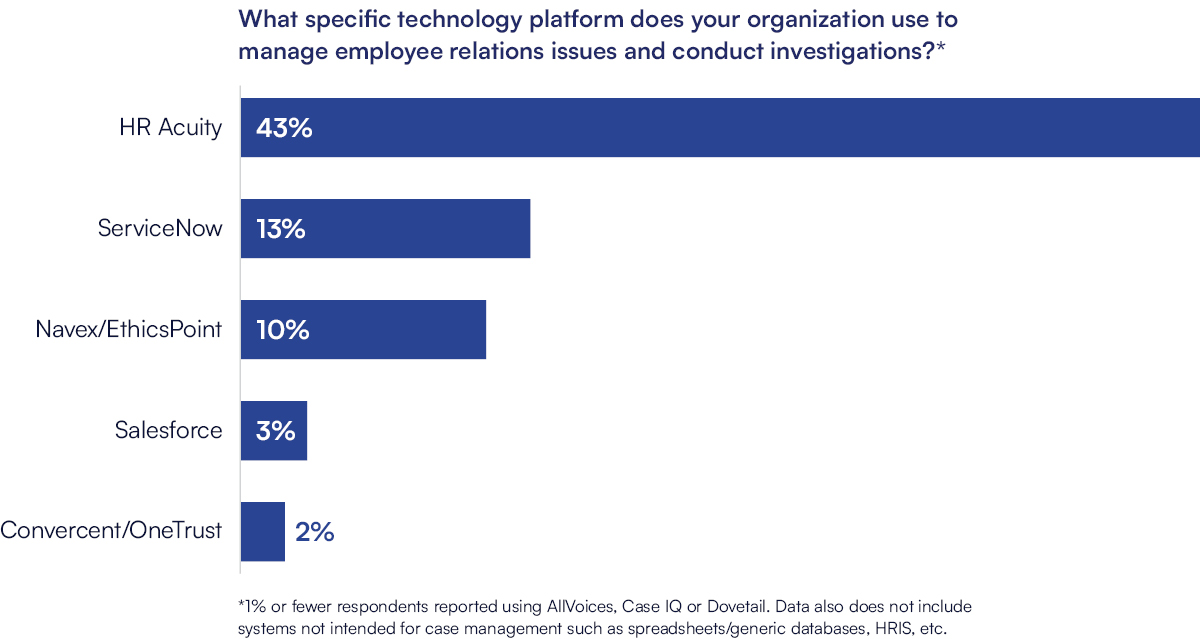
2024 participants included 43% HR Acuity customers and 57% users of other systems and approaches.
Respondents were asked to rank the top three benefits of their current case management system for tracking workplace investigations.
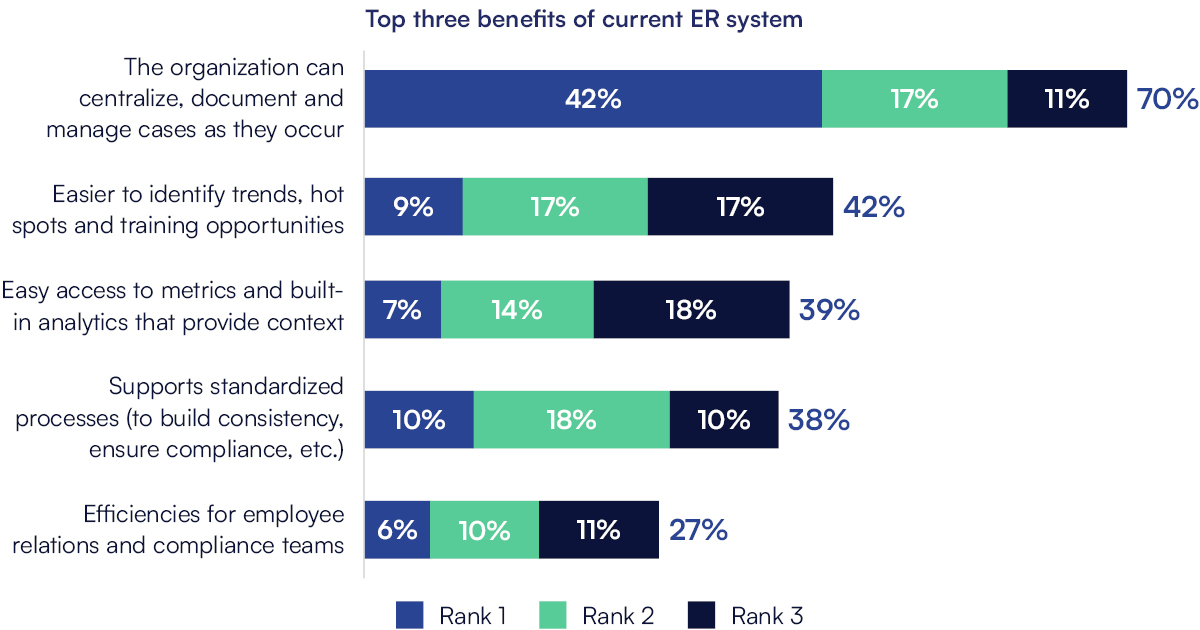
Employee relations teams cited benefits that support their everyday needs to maximize efficiency and effectiveness including centralized, standardized processes and ready access to metrics and analytics. These benefits allow teams to easily spot trends and the need for targeted initiatives and training opportunities.
What is the Top Employee Relations Case Management and Investigations Tool?
Technology That Bridges the Gap Between Employee Relations and Compliance Drives Effectiveness
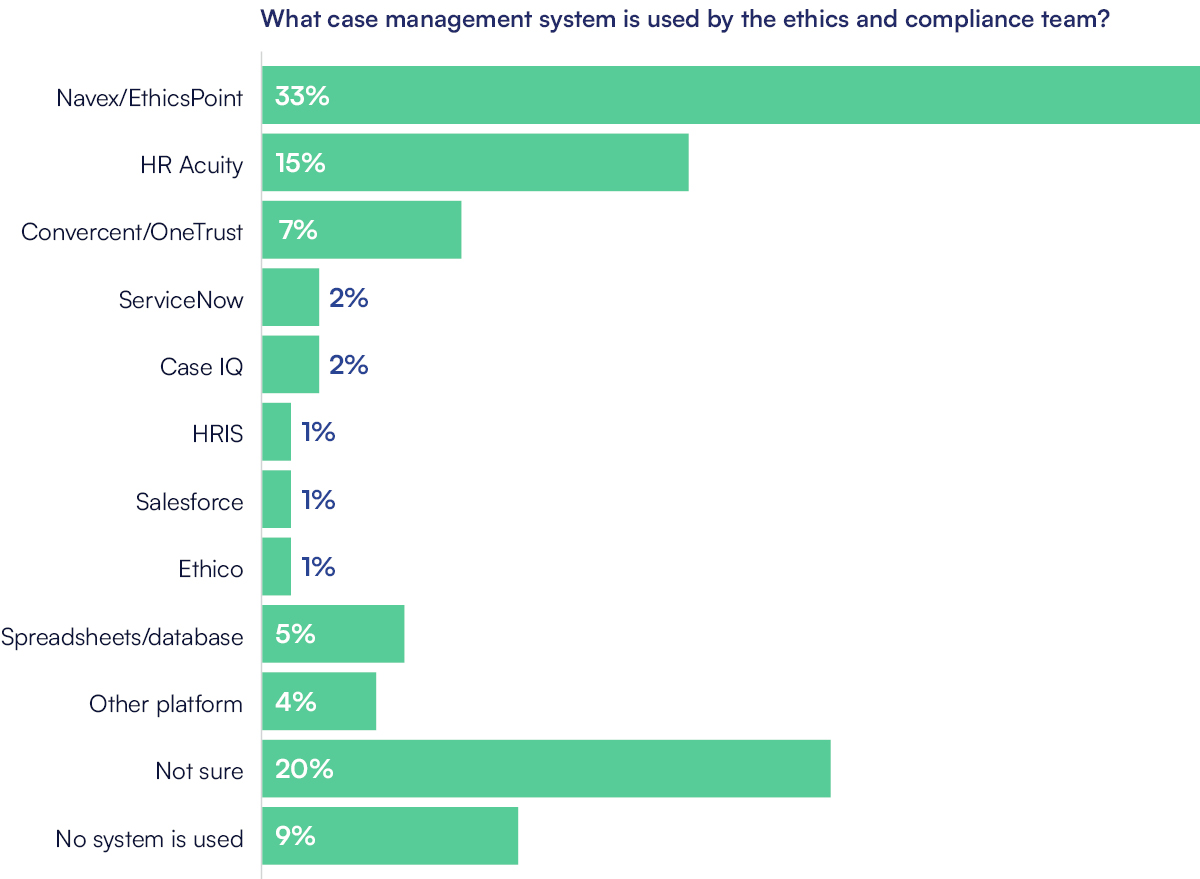
To better understand the use of case management systems, 2024 respondents were asked about how Ethics and Compliance teams track cases. Just over one third of organizations use the same case management systems to support both the HR/ER and Ethics and Compliance functions. Single-solution platforms were also more common among Fortune 100 and Global 500 companies.
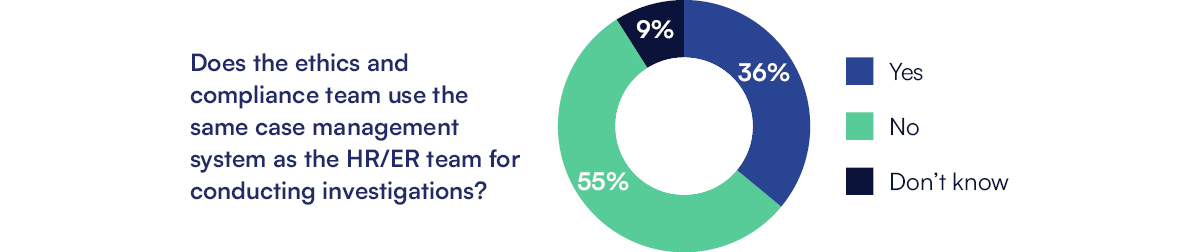
How Ethics and Compliance Teams Track Employee Relations Cases and Investigations
When different systems are used to handle cases and conduct investigations, teams may struggle to develop a comprehensive view of case management data and easily identify trends across the organization. That one in five organizations didn’t know what system their Ethics and Compliance colleagues use also suggests that information silos often exist between ER/HR and Ethics and Compliance. Organizations will benefit from solutions that can be configured to meet each function’s specific needs and offer efficiency and visibility across the organization to proactively spot and address patterns trends.
Metrics & Analytics
How Employee Relations Drives Impact with Metrics
Developing data-driven employee insights and initiatives remains the most common use of metrics. Yet in 2024, significantly fewer organizations used their data to identify training needs, create better policies, identify potential equity and inclusion issues or to identify staffing needs.
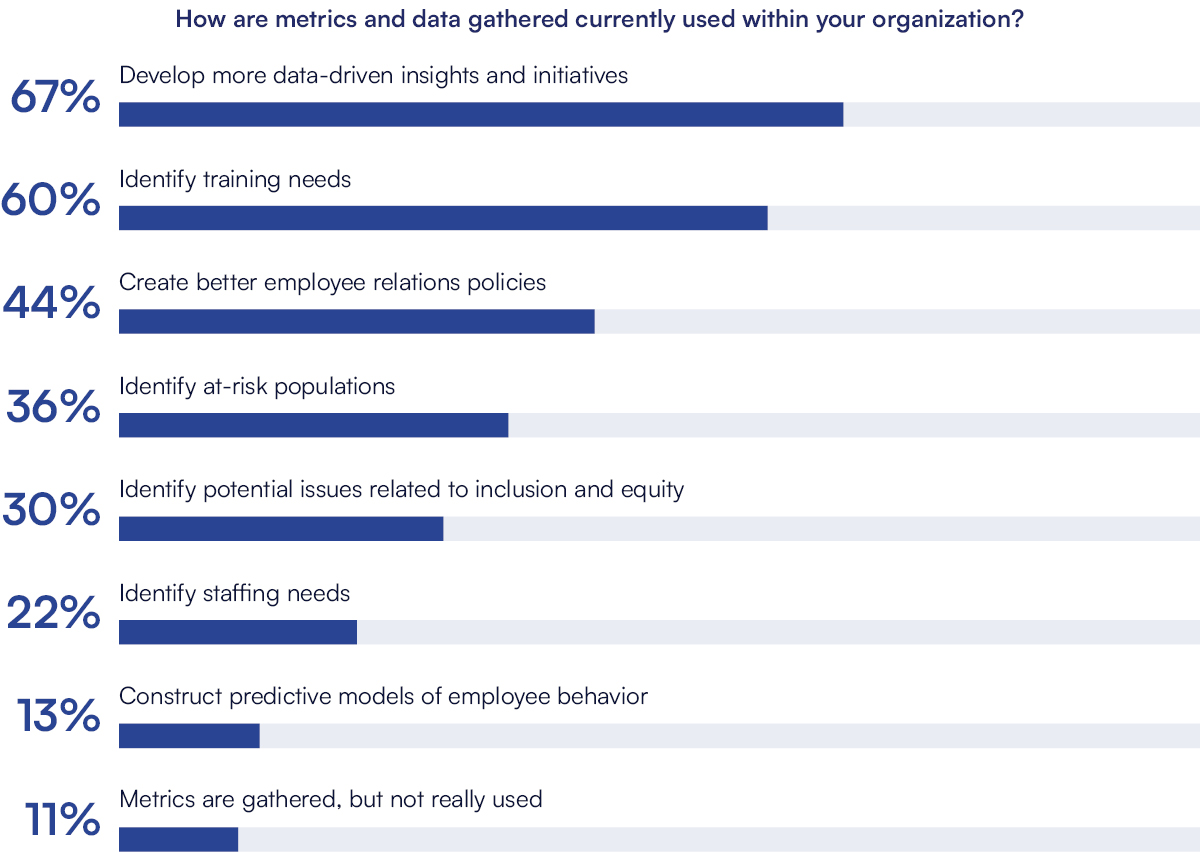
This shift may indicate that organizations are less focused on specific applications of their data and instead are using data to look for broader insights across a range of employee-related initiatives. The decrease in applying data to understand equity and inclusion may also reflect the current U.S. political environment.
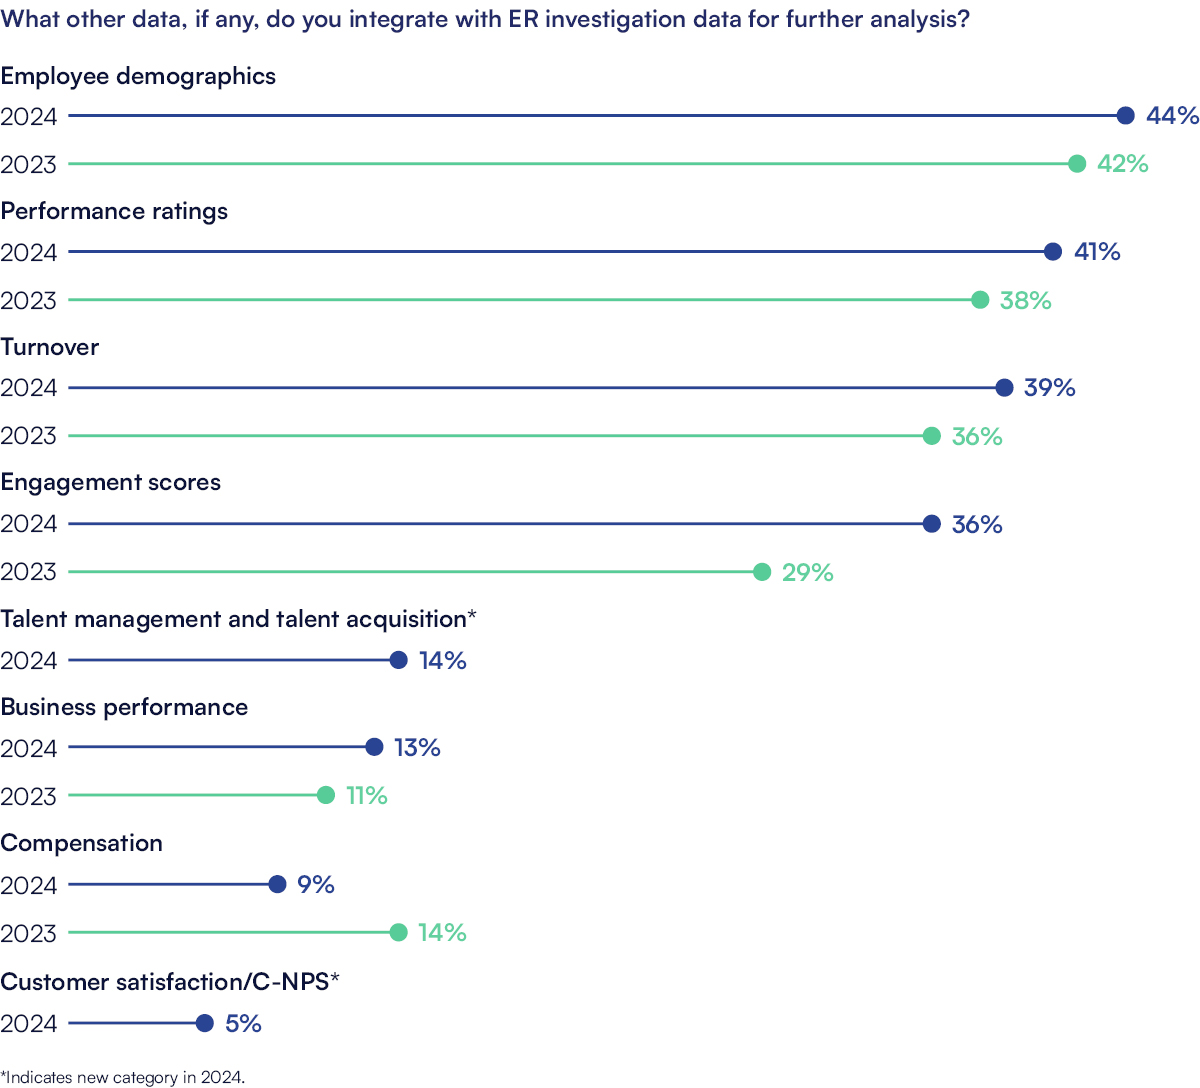
Advanced Analytics Inform Smarter, Targeted Employee Relations Strategies
It is common for employee relations teams to combine employee data with investigation data to obtain deeper insights. The data most often integrated with employee relations and investigation data includes demographics, performance ratings, turnover and engagement scores.
In 2024, the Benchmark Study assessed two new categories for data integration: Talent management and customer satisfaction data. Analyzing these datasets alongside employee relations and investigation data can unlock insights to inform targeted training and development programs. They help paint a more holistic picture that can reveal how employee engagement and workplace culture directly impact business outcomes. However, they are not yet widely used.
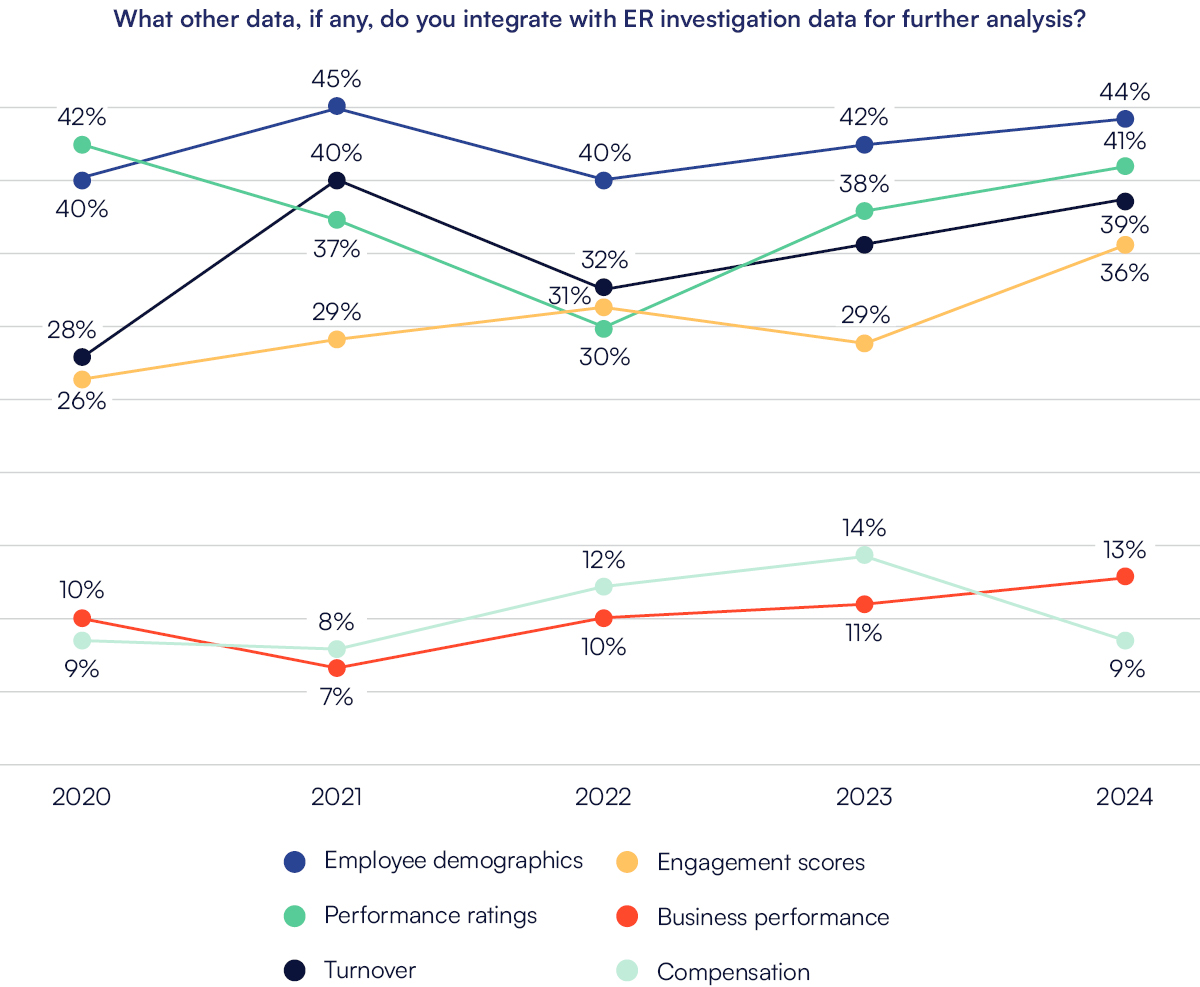
Employee Relations Trends in Advanced Analytics
Looking at the practice of integrating employee data with employee relations and investigation data for advanced analytics over time, the Benchmark Study shows a steady increase and more consistent use of performance ratings, turnover and engagement scores. Combining these data streams transforms raw information into actionable insights that can be used to create a more cohesive, productive and engaged workforce and a better workplace culture.
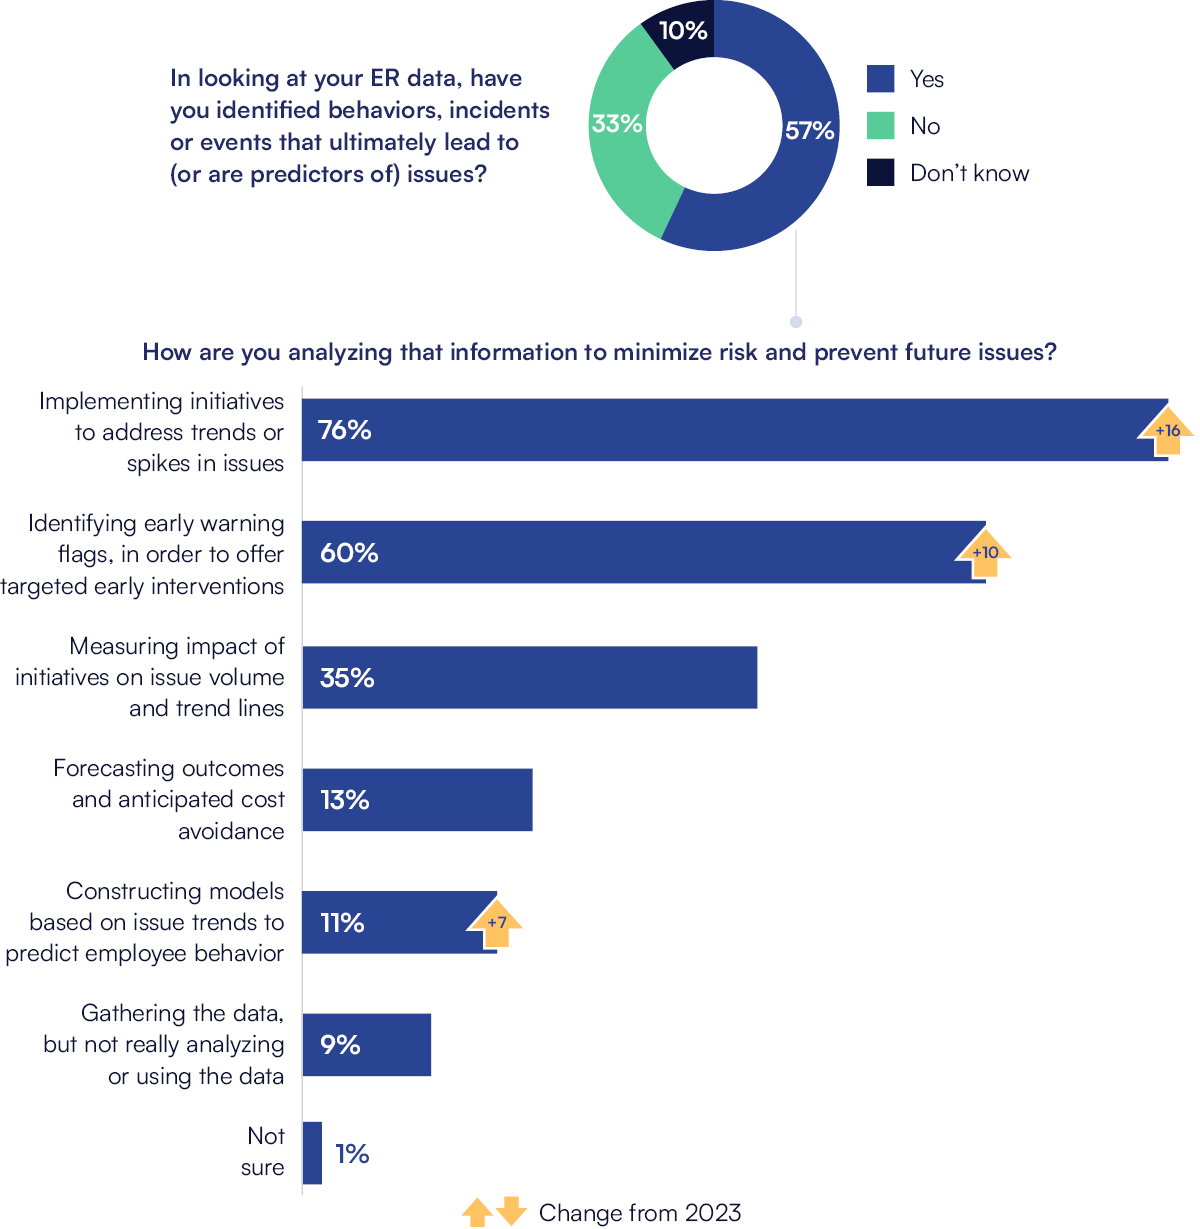
Data-Driven Predictions Reduce Risk and Demonstrate the Value of Employee Relations
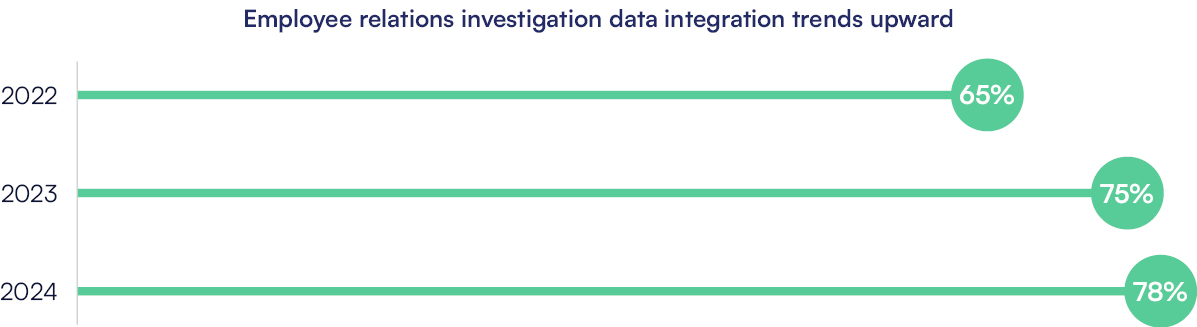
The findings highlight a growing trend: Organizations are increasingly leveraging employee relations data to predict and prevent future issues. From identifying early-warning flags to addressing trends and spikes, the sharp rise in using ER data for proactive interventions underscores the critical role of data in safeguarding workplace culture and mitigating risks before they escalate.
Real World Success Stories: How Organizations are Using Employee Relations Data for Meaningful Outcomes
Enhancing People Leader Competencies
- “ER and survey data are the primary drivers for our 2025-2027 roadmap for Manager Effectiveness; Primary focus is to improve manager capabilities and development, launching Manager Essentials and standing up the new People Consultant model dedicated solely to supporting mid-level management.”
- “Identified issue trends for a particular business area and developed scenario-based training to educate managers on how to handle issues effectively so they don’t escalate; Saw a reduction in cases compared to historical data for specific events within the organization.”
- “Trained 180 store managers and regional directors (15K employees) on fostering positive work environments and addressing ER trends; Resulted in a 30% drop in hourly turnover, 25% fewer ER cases and improved manager handling of lower-risk issues without ER support.”
New Initiatives to Prevent Risk and Reduce Case Volumes
- “Mental health case data resulted in sponsorship of mental health certification for targeted teams.”
- “Received a significant number of complaints about employee conduct in one location that did not rise to the level of policy violations but raised concerns about interpersonal conflict and communication; Introduced a facilitated conversations program and partnered with a community mediation provider to help employees resolve one-on-one conflicts to de-escalate and minimize risk of more serious policy concerns.”
- “Found alcohol use was involved in 70% of sexual harassment claims; Created training and clarified the workplace definitions and where policies apply.”
- “Noticed a spike in social media policy violations; Used data to provide a refresher course on our policy and saw an immediate drop in cases.”
- “Spotted a trend in complexity of ADA and mental health cases; HRBPs were spending extensive time as ‘social workers’; Data led to creating a new position to support complex, high needs medical cases in cooperation with benefits.”
Data-Driven Solutions to Shape Employee Relations Strategies
- “Tracking performance case data has shown a positive trend of increasingly proactive performance management, in alignment with our company’s key goals.”
- “Data shows that case increases match hiring increases; It has also shown that separating duties has been effective in focusing the team on employee relations during a time of student hiring.”
- “Used data to track benefits and LOA cases; Created a new, more efficient LOA process that also saves time for employees.”
- “Analyzed performance data to dig into unregretted attrition to uncover causes for turnover – i.e., low annual cycle ratings, midyear review ratings, new hires; Helped us make educated assumptions to increase talent density on a regular basis.”
- “Experienced a salting event by a local union; Used data to communicate and educate employees and minimize card signing.”
- “Analyzed tenure data on disciplinary actions and substantiation rates to understand the impact on productivity; Leveraged the insights to build a compelling case for aftercare and secured the CHRO support for implementing the program.”
- “Determined that nearly 50% of cases could be handled locally with proper guidance; Created an intake system to ensure leaders complete all steps before escalating cases.”
- “Uncovered frequent behavioral challenges and implemented fixes to rectify, saving the company money.”
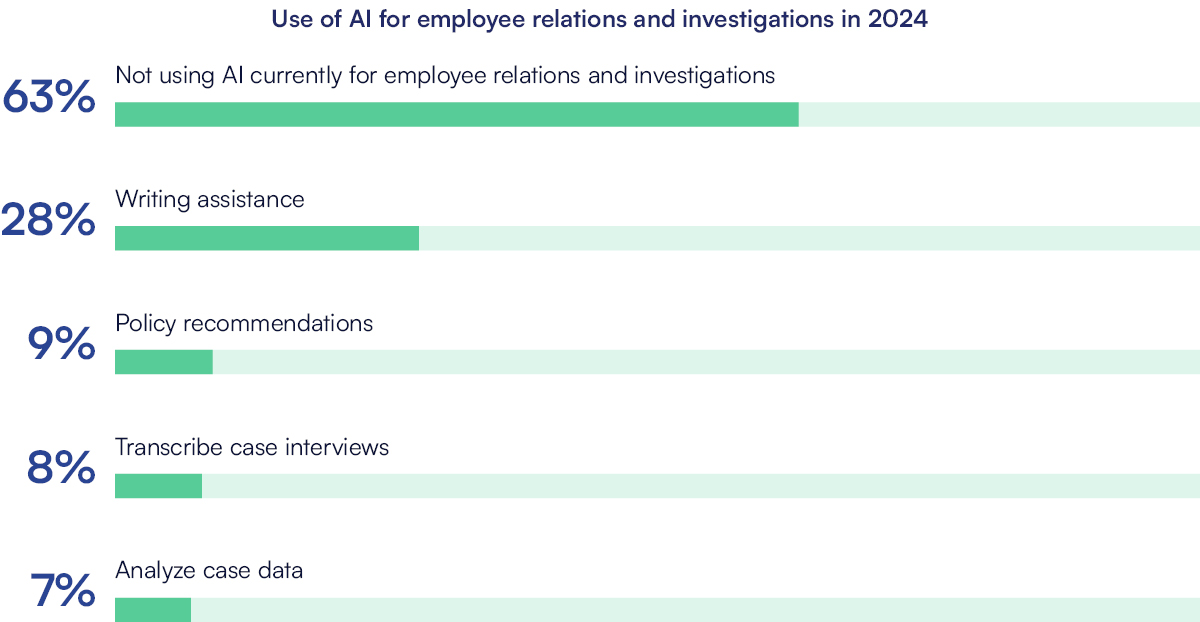
AI in Employee Relations
Limited AI Adoption in Employee Relations Suggests Barriers Exist
AI is still in the earliest stages of adoption for use in employee relations and investigations for most of organizations. Nearly half of respondents characterized their organization’s AI use as non-existent and only one-third or organizations are piloting and experimenting.
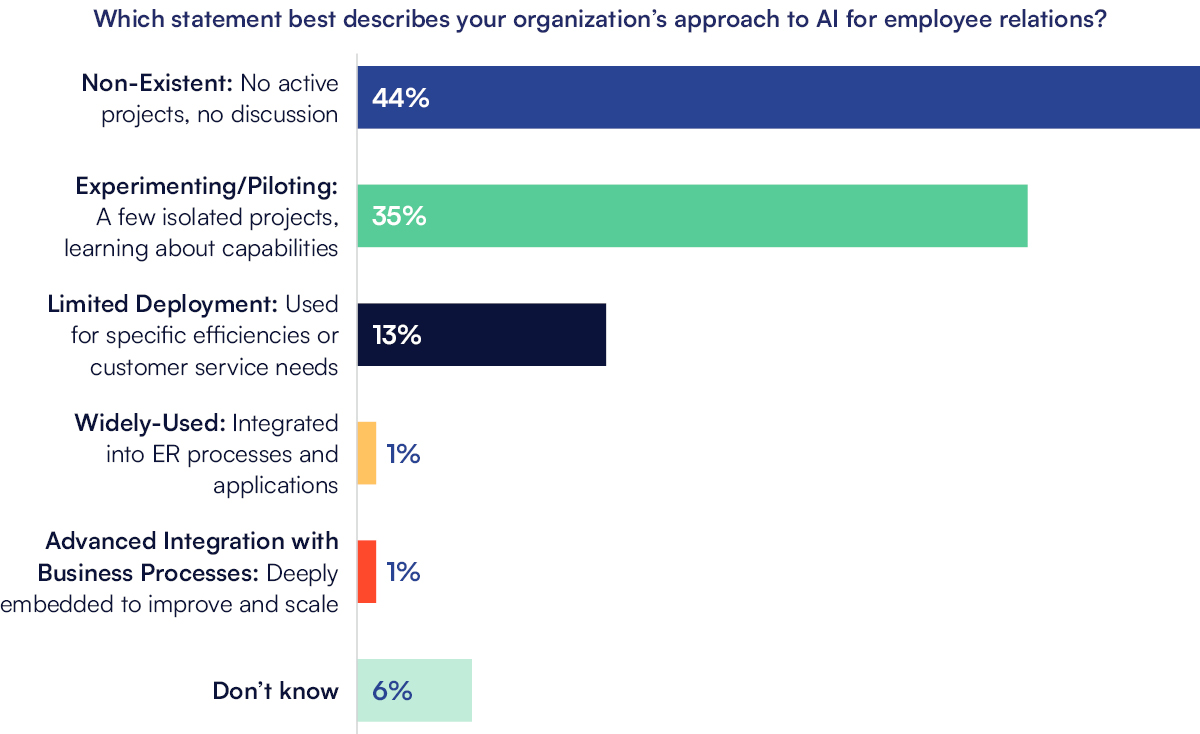
Legal, ethical and compliance concerns, coupled with the sensitive nature of employee issues, is likely causing organizations to tread carefully and develop an approach that safeguards intellectual property and protects employee and customer information.
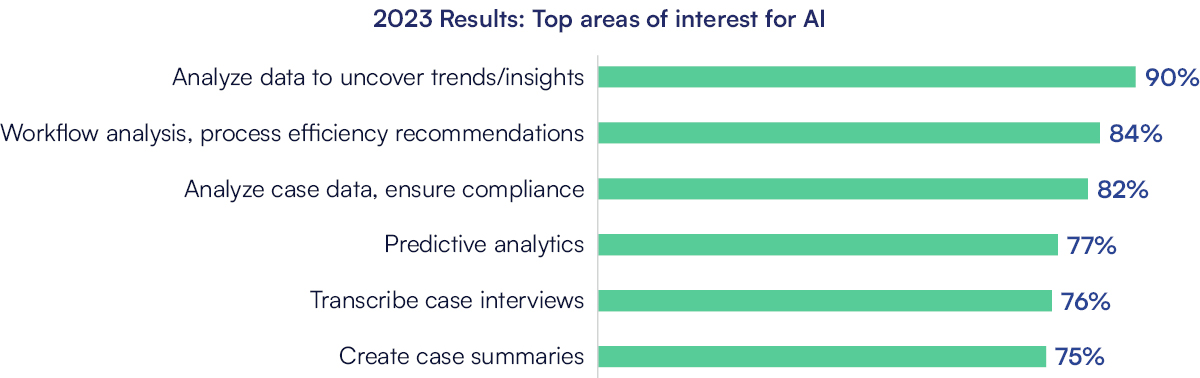
Unlocking the Benefits of AI Requires Thoughtful Adoption
The 2023 Benchmark findings showed strong interest in using AI to gain value from data and accelerate staff productivity. This year’s Study revealed that while interest in AI for employee relations remains high, most organizations have yet to fully harness its potential. Writing assistance led current applications, but broader adoption lagged as organizations struggle to adopt clear strategies and safeguards.
To unlock AI benefits such as enhanced productivity and data-driven insights, organizations must define ethical, responsible use, implement guardrails and prioritize tools that complement, not replace, the human element of employee relations. As AI adoption evolves, the Benchmark Study will continue to spotlight best practices and success stories to guide the way forward.
Real World Success Stories: How Organizations Are Enhancing Employee Relations with AI
- “We’ve integrated AI and will continue to focus on use improvements this year. We’ve drafted questions, templates, scripts, timetables, etc., saving time for the team from doing this manually.”
- “AI is allowing for automated case entry, eliminating a large intake team and, thus, reducing resources. AI is improving report writing which saves time for our employee relations team.”
- “AI has increased our efficiency, but not everyone has adopted it. It is used more often at the manager level and above. We plan to roll out more AI guidelines to remove some administrative lift on the team.”
- “AI has allowed us to gather information more quickly and efficiently. We use machine learning and other tools for investigation transcripts, workflow analysis, trending and analytics.”
- “We are piloting the ethical use of artificial intelligence within the investigative process, and it is on our 2025 roadmap. We see great promise.”
- “We are taking a measured approach to ensure data privacy and integrity is built into all AI uses within investigations. We anticipate increased use of AI for case management and data insights.”
- “Summarizing interview notes into a case summary is one area of artificial intelligence our team is interested in exploring, in order to reduce administrative work.”
AI has streamlined consistent messaging in investigative conclusion memos and corrective action templates.
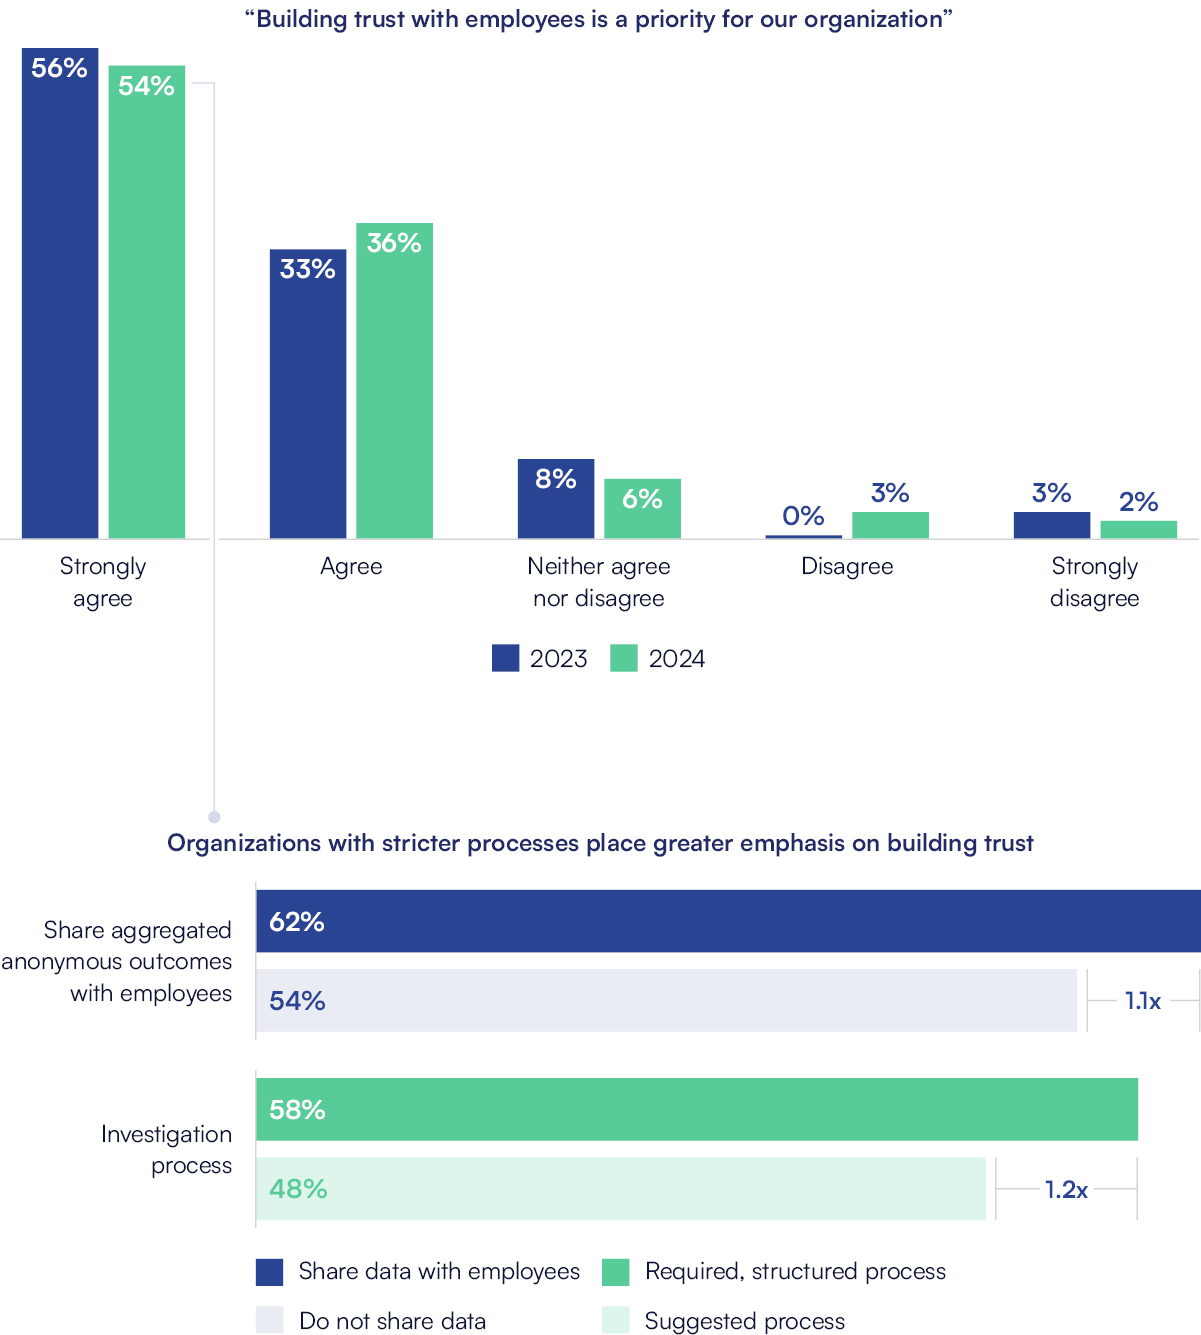
Building Trust in Employee Relations
Standard Processes and Transparency Create a Strong Foundation for a Trusted Workplace
Building employee trust is an ongoing priority for nearly all organizations, with this year’s findings echoing those of 2023. A stronger prioritization of employee trust correlates to operational practices such as sharing investigation/ER data and a standardized investigation process.
ER/Q Maturity Model
What is ER/Q?
The employee relations maturity model provides a means to establish a baseline and serves as a guide to help organizations next level their employee relations with simple, practical, actionable steps to improve employee experience, build transparency across the organization and further elevate the function.
Organizations with a high ER/Q rely on industry standard practices, data-driven insights and proactive decision-making across the organization. To learn more about ER/Q or take the assessment, visit www.hracuity.com/erq.
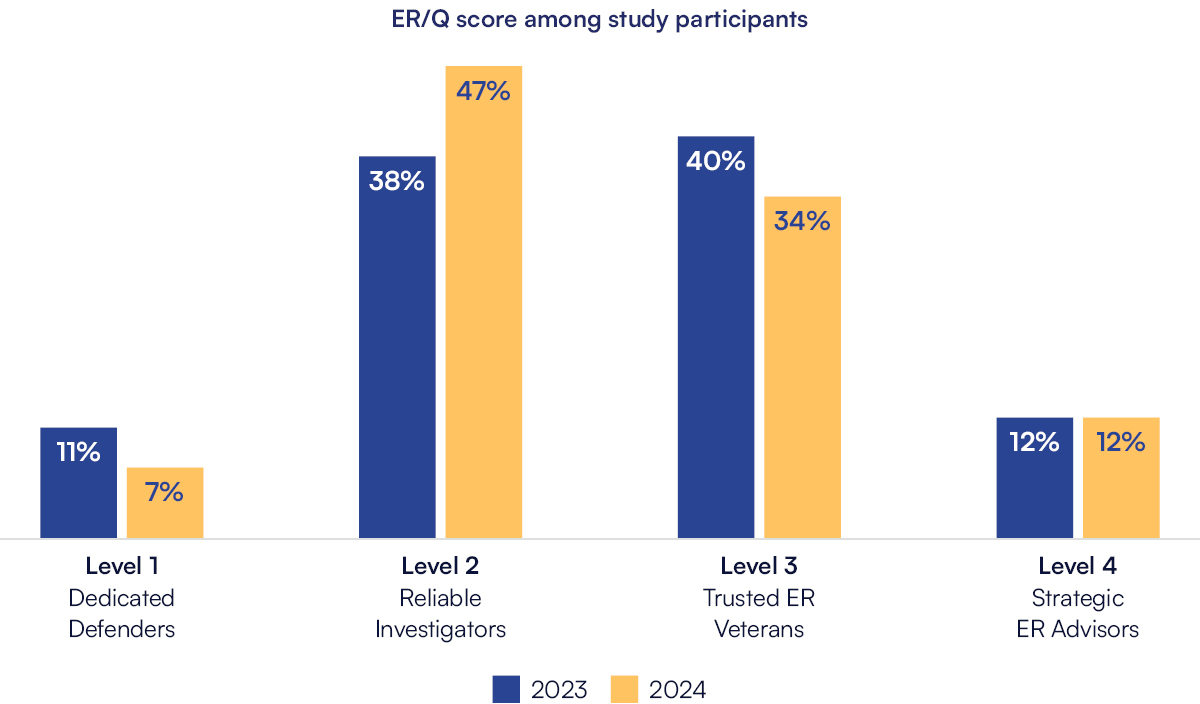
Trends in Employee Relations Maturity
The ER/Q model was designed to help organizations understand the current maturity level of their employee relations function based on its purpose, processes and influence on the organization and provide insights to enhance impact. ER/Q scores for organizations that participated in the Benchmark Study mirror the pattern of overall ER/Q scores, with most organizations at Level 2 or Level 3 in their ER/Q Maturity.
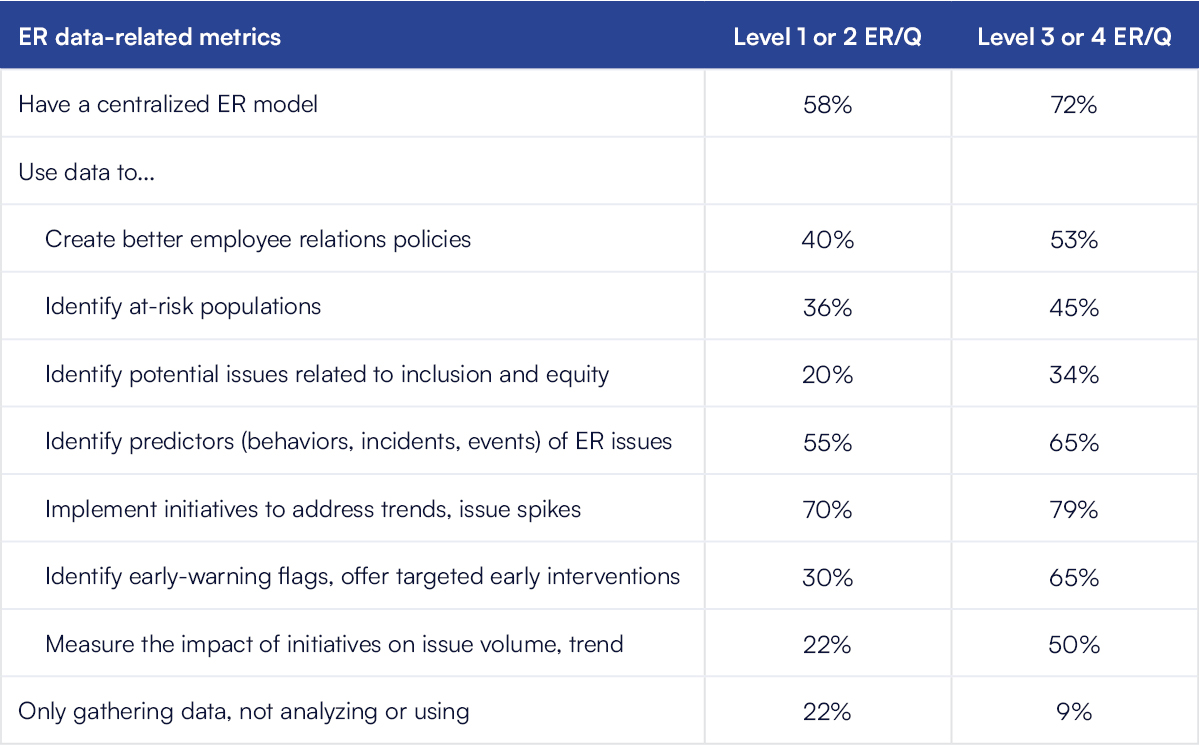
A Higher ER/Q Correlates to More Comprehensive Use of Employee Relations Data
Organizations with a level 3-4 ER/Q are more likely to use their data for a variety of actions and initiatives, including policy creation, identifying predictors of ER issues and developing initiatives to minimize risk and prevent future issues.
Methodology & Terminology
Explore the Benchmark Study Methodology
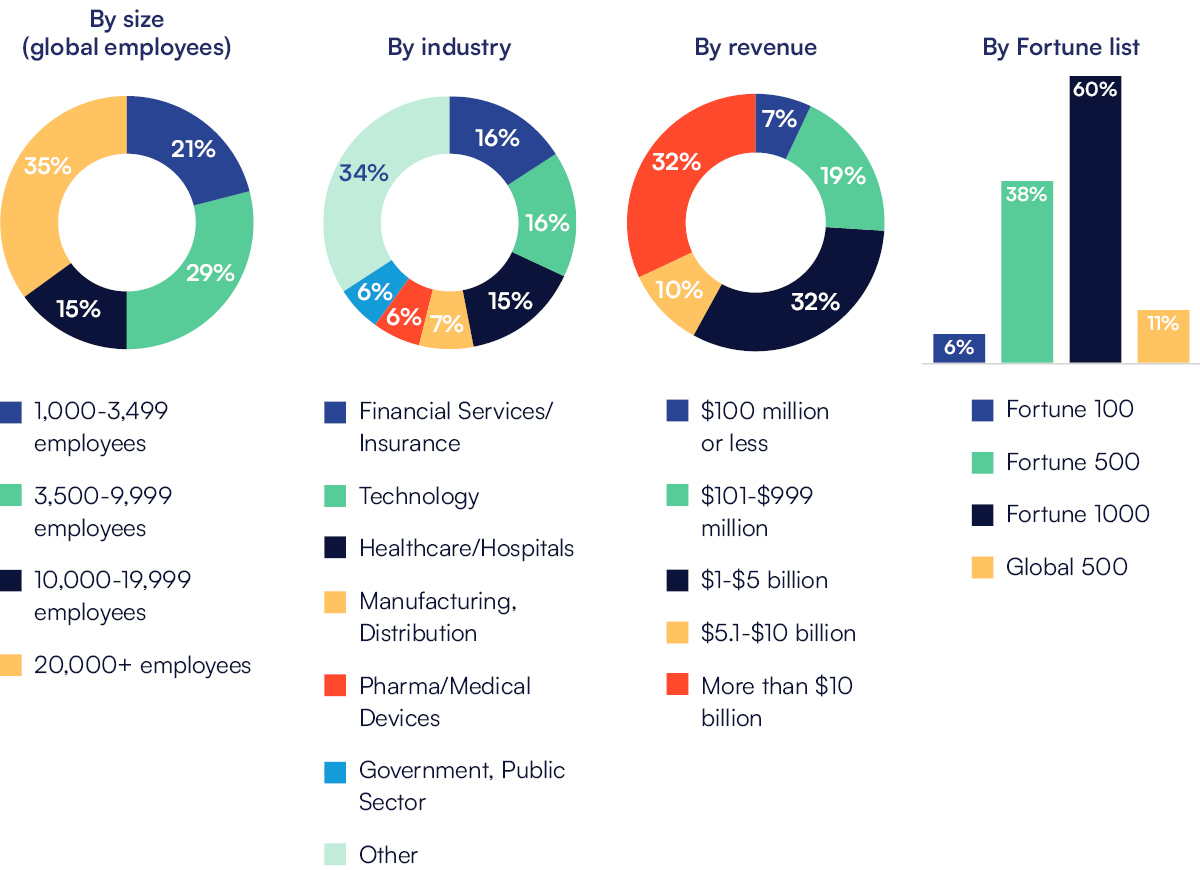
HR Acuity, in partnership with Isurus Market Research, fielded an online survey via email and social media targeting employee relations professionals at U.S.-based enterprise organizations with at least 1,000 employees. Participants included employee relations leaders from 284 organizations, representing 8.7 million employees globally.
The data reflects employee relations practices from the 2024 calendar year. The research was conducted between January 15 and March 7, 2025 and has a confidence level of +/- 5.8 percentage points (95% confidence interval). The report highlights yearly changes in the results only when there are statistically significant differences.
Terms Used in the Employee Relations Benchmark Study
Employee Relations Professionals: Individuals who are dedicated to managing or working on employee relations matters
HR Business Partners/Generalists: Provides strategic/operational human resources support to business or functional areas
Employee Relations Quotient: An employee-relations specific maturity model designed to help organizations measure and improve employee relations processes
Employee Relations Organizational Models
Centralized: Centralized team of Employee Relations Professionals or Center of Expertise (“COE”) responsible for managing employee relations issues and conducting investigations across the organization (Note: This group does not have to be geographically centralized)
Mixed: Centralized team for managing some or most of the employee relations cases and investigations but field resources (HRBPs/Generalists and/or managers) still manage some employee relations issues
Decentralized: Employee relations issues are managed within the specific lines of business by HR Business Partners/Generalists or Employee Relations Professionals; Employee Relations matters are not centralized
Acronyms Used in the Employee Relations Benchmark Study
CHRO
Chief Human Resources Officer
COE
Center of Excellence
EEOC
Equal Employment Opportunity Commission
ER
Employee Relations
ERP
Employee Relations Professional
ER/Q
Employee Relations Quotient
FTE
Full-Time Equivalents
HR
Human Resources
HRBP/G
Human Resource Business Partner/Generalist
HRIS
Human Resource Information System
Employee Relations Benchmark Study Respondent Profile
This year’s Benchmark Study included participation from a wide range of industries and titles including CHROs, Heads of HR, Vice Presidents, Senior Directors, Senior Managers and HRBPs. Notably, 73% of respondents held leadership roles.
Findings include input from 284 organizations representing more than 8.7 million employees globally, including 125 of the Fortune 100 and 500 companies.
Explore Past Employee Relations Benchmark Studies
Dive into the most comprehensive analysis of the emerging trends in employee relations.
-
Explore Now

The Eighth Annual Employee Relations Benchmark Study
Our Eighth Benchmark Study revealed a sharp rise in mental health challenges driving record workplace issues, increased data use to improve employee insights and low AI adoption in employee relations.
-
Explore Now

The Seventh Annual Employee Relations Benchmark Study
Our Seventh Benchmark Report highlighted strategies to navigate the surge in mental health issues post-pandemic and strengthen confidence in the employee relations function.
-
Explore Now

The Sixth Annual Employee Relations Benchmark Study
Our Sixth Benchmark Report demonstrated that urgency to strengthen trust, transparency and foundational ER practices has never been greater to meet rising employee expectations and drive meaningful change.
-
Explore Now

The Fifth Annual Employee Relations Benchmark Study
Our Fifth Benchmark Report highlighted the evolution of employee relations over the decade and called attention to setbacks in investigations, transparency and resources that required urgent focus.
-
Explore Now

The Fourth Annual Employee Relations Benchmark Study
Our Fourth Benchmark Report celebrated employee relations’ growing role and data-driven focus during unprecedented times, highlighting industry best practices and rising transparency.
-
Explore Now

The Third Annual Employee Relations Benchmark Study
Our Third Benchmark Report marked employee relations’ rise as a strategic business partner, highlighting its growing influence in shaping safer, more productive workplaces.
-
Explore Now

The Second Annual Employee Relations Benchmark Study
Our Second Benchmark Study launched amid the #MeToo movement, establishing crucial standards for managing workplace misconduct and empowering ER leaders with data-driven insights from over 100 organizations worldwide.
-
Explore Now

The First Annual Employee Relations Benchmark Study
In the First Benchmark Study, discover how organizations like yours tackle employee relations challenges using proven processes, management models, technology and strategies to strengthen ER outcomes.
Research Links
- Visit the DOI for this year’s Benchmark
- Visit Deb Muller’s ORCID Profile